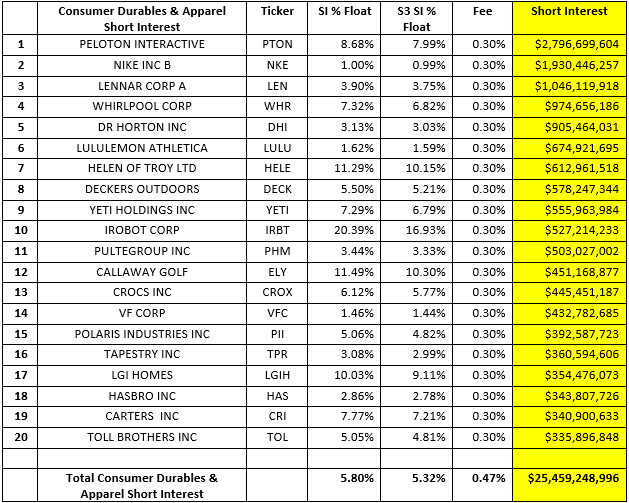
Short sellers in Peloton Interactive Inc (PTON) must feel like they are pedaling through Stage 15 of the Tour de France, climbing 2,221 meters to the peak of Port d’Envalira in Andorra. PTON’s stock price has surged +52% since it hit its low of $82.62 on May 5th and short sellers have given back most of the profits they earned in the first four months of the year. PTON short interest is $2.80 billion, 22.25 million shares shorted, 8.68% Short Interest % Float, 7.99% S3 Short Interest % Float, 0.30% stock borrow fee. PTON is the largest short in the domestic Consumer Durables and Apparel Sector.

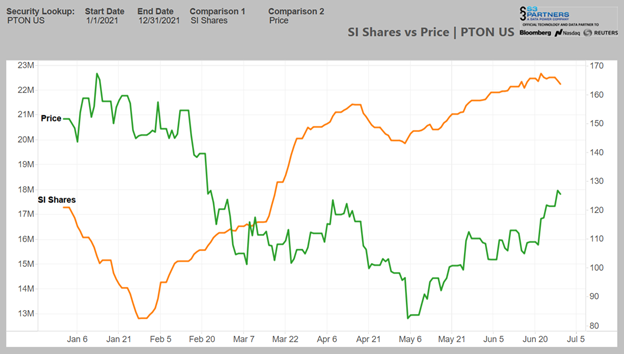
PTON shorts have been very active in 2021, after some initial short covering in early January short sellers have been building their positions as PTON’s stock price slid -47% to its year-to-date low of $82.62 on May 5th. We have seen 9.43 million shares of PTON shorted, worth $1.18 billion, since PTON hit its low shares shorted of 12.82 million shares on January 28th. Short selling had continued unabated even during its recent price rebound with 2.19 million shares shorted, worth $275 million, since May 5th – an increase of +11% even as its stock price surged +52%.
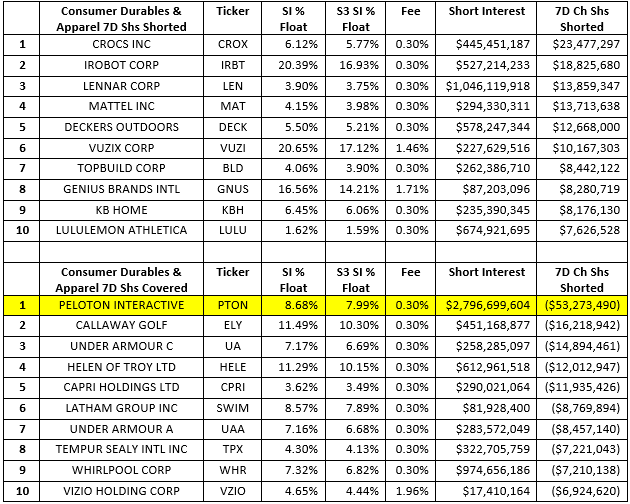
But we may finally be seeing the start of a PTON short squeeze with 424 million shares covered over the last week, a decrease of -1.87% as its stock price rose +7.26%

Crocs Inc (CROC), iRobot Corp (IRBT) and Lennar Corp (LEN) had the largest amount of new short selling over the last week while Peloton Interactive (PTON), Callaway Golf (ELY) and Under Armour C (UA) saw the largest amount of new short covering over the last week.

Trading in PTON has increased recently with shares traded over the last week and a half averaging 10.2 million shares a day versus 7.2 million shares a day from June 1st to 18th, a +39% increase. As my daughter-in law Katie pointed out to me, retail buy-side interest and PTON chatter in coffee shops, supermarkets and malls is increasing and the large increase in trading volume implies that the institutional side is also getting more active in the stock.
This buy-side pressure has pushed PTON’s stock price up +52% off its year-to-date low after being down -41% from Jan 1st to June 5th. PTON’s stock price is still down -18% for the year.
PTON shorts were up +$1.08 billion in net-of-financing mark-to-market profits as of May 5th but have given back $922 million of those mark-to-market profits since then. Shorts are now up “only” +$163 million in year-to-date mark-to-market profits. As these mark-to-market losses mount PTON short sellers are more likely to cover their shorts in order to realize some of their profits.
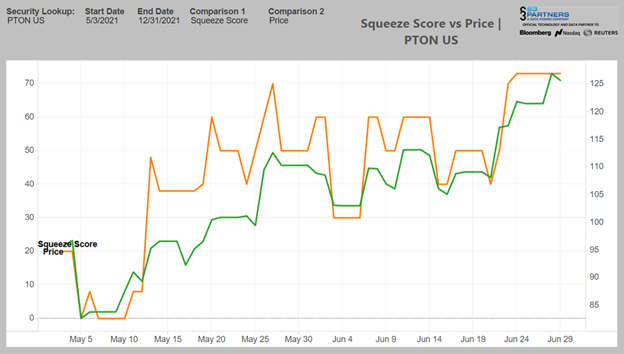
PTON’s Squeeze Score has risen from a 0.00 in early May to 72.50 today. PTON’s large dollar short interest but relatively low S3 Short Interest % Float of 7.99%, palatable 2.24 Days To Cover and General Collateral stock borrow rate will keep it from reaching a 100.00 Squeeze Score, so its 72.50 score is high relative to its 42.50 Crowded Score.
Other stocks in the Consumer Durables and Apparel Sector with higher Squeeze Scores are Vuzix Corp (VUZI) 80.00, Smith Wesson Brands Inc (SWBI) 70.00 and iRobot Inc (IRBT) 70.00.

It looks like the race to the Champs-Elysees between PTON long buyers and short sellers is on with short sellers starting to tire in these final stages.
Looking at short selling trends over time provides insight into overall market sentiment as well as the strength of bearish conviction in individual equities. Our Blacklight SaaS platform and Black APP provides an up to date view of short selling and short covering on an equity, sector, index, or country-wide basis allowing investors\traders to better manage their existing long and short positions.
Research Note written by Ihor Dusaniwsky, Managing Director of Predictive Analytics, S3 Partners, LLC
For deeper insight into short side data and analysis contact me at Ihor.Dusaniwsky@S3Partners.com
For short side data and access to our research reports go to https://shortsight.com/
Click for 10 Day Complimentary Access to Bloomberg/S3 Black App Pro
The information herein (some of which has been obtained from third party sources without verification) is believed by S3 Partners, LLC (“S3 Partners”) to be reliable and accurate. Neither S3 Partners nor any of its affiliates makes any representation as to the accuracy or completeness of the information herein or accepts liability arising from its use. Prior to making any decisions based on the information herein, you should determine, without reliance upon S3 Partners, the economic risks, and merits, as well as the legal, tax, accounting, and investment consequences, of such decisions.