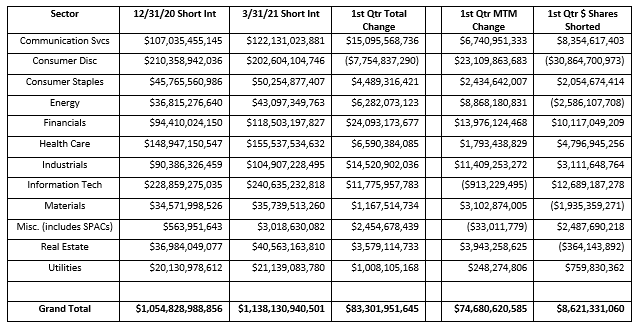
Short interest in the domestic market increased by +$83.3 billion, or +7.90%, to $1.14 trillion in the first quarter of 2021. With the overall market rallying, the majority of this increase, +$74.7 billion, came from mark-to-market appreciation of the shorted securities, but there was also +$8.6 billion of additional short selling in the quarter.
Every sector except Consumer Discretionary (-$7.75 billion) saw an increase in short exposure in the quarter. The largest increase in short exposure occurred in the Financial (+$24.1 billion), Communication Services (+$15.1 billion) and Industrials Sectors (+$14.5 billion).
Short exposure continues to be concentrated in several sectors: Information Technology ($241 billion) Consumer Discretionary ($203 billion) and Health Care ($156 billion).

Due to overall market appreciation and the trend to short over-bought, upward trending, momentum stocks the average stock price of a shorted stock has increased. This means that short sellers needed to short fewer actual shares of a stock in order to achieve the same short dollar exposure. The weighted average price of a shorted stock in the Russell 3000 was $51.29/share on December 31st, 2020 and climbed to $58.32/share as of March 17th, 2021. In less than three months short sellers, on average, would need short 14% fewer shares of stock to achieve the same dollar short exposure.
As an example, $100 million of short exposure in GameStop (GME) would have been taken 9.53% of its float shares on December 31st, 2020 (stock price of $19.26) but only 0.97% of its float shares on March 17th, 2021 (stock price $189.82). In this example, short Interest as a % of Float declined while dollar short interest exposure remained unchanged.
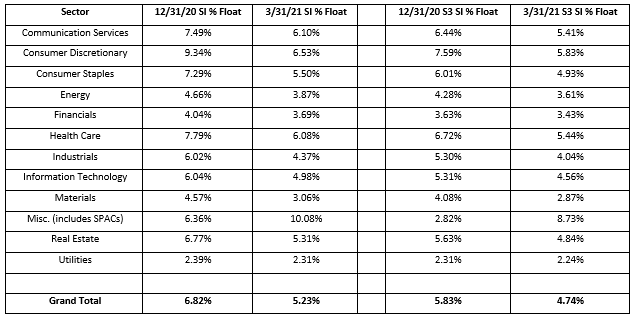
A decline of SI % Float does not necessarily mean that there is less short exposure of a stock in the market, it just means that there are fewer physical shares shorted. Even though we see traditional Short Interest as % of Float declining in the 1st quarter from 6.82% to 5.23% and the S3 SI % Float (which includes the synthetic longs created by every short sale in the Float number) declining from 5.83% to 4.74% actual dollars at risk on the short side increased.
In effect, shorts were betting two $25 chips instead of four $10 chips on their pocket Jacks, betting a few more dollars but using less chips.

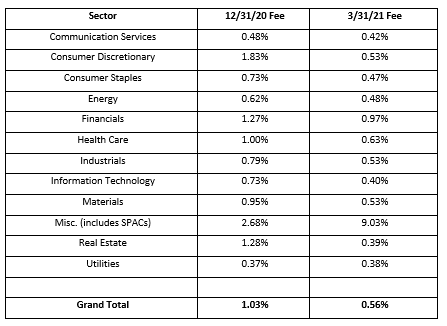
As the number of shares shorted decreased over the quarter and short sellers picked less crowded stocks to short, stock borrow rates became less expensive. The average stock borrow rate for existing shorts has almost halved, going from 1.03% to 0.56% fee.
Less shares shorted needed to maintain the same dollar borrow exposure led to more stock borrow returns which led to less demand for existing stock borrow supply which resulted in cheaper stock borrow rates.
Stock borrow rates in our Miscellaneous Sector increased significantly as SPAC short selling exploded during the quarter. The relative illiquidity of SPAC stock borrows made shorting these newly issued and mostly non-institutionally held shares more expensive than “regular” equities.
Overall short sellers paid $2.01 billion in stock borrow fees in the first quarter of 2021 (calculated daily borrow cost using S3’s offer rate) versus $1.99 billion in stock borrow expenses in the fourth quarter of 2020. Seven stocks made up a fifth of the total domestic equity stock borrowing costs: FUTU -$167mm, GME -$71mm, LMND -$37mm, RKT -$32mm, QS -$30mm, TSLA -28mm and IFF -$24mm.

Short sellers were down -94.6 million in 1st quarter mark-to-market losses, -8.31%. With the Russell 3000 up +5.97% for the quarter, short sellers under performed the market by -2.34%.
There were 5,873 shorted equities with positive P\L, producing +$36.1 billion in profits. The largest short-side winners in the 1st quarter were: TSLA +$1,304mm. AMD +$1,096mm, SRPT +$641mm, AAPL +$600mm and COUP +$592mm.
There were nearly double the number of shorted equities with negative P\L, 10,438 in total, producing -$132.2 billion of losses. The largest short-side losers in the 1st quarter were: GME -$6,171mm, FUTU -$1,914mm, VIAC -$1,129mm, BBBY -1,084mm and W -$989mm.
Only our Miscellaneous sector, which is primarily made up of SPAC stocks, had a positive short-side return in the 1st quarter, with Energy, Industrials and Real Estate having the worst returns.

Looking at short selling trends over time provides insight into overall market sentiment as well as the strength of bearish conviction in individual equities. Our Blacklight SaaS platform and Black APP provides an up to date view of short selling and short covering on an equity, sector, index, or country-wide basis allowing investors\traders to better manage their existing long and short positions.
Research Note written by Ihor Dusaniwsky, Managing Director of Predictive Analytics, S3 Partners, LLC
For deeper insight into short side data and analysis contact me at Ihor.Dusaniwsky@S3Partners.com
Click for 10 Day Complimentary Access to Bloomberg/S3 Black App Pro
The information herein (some of which has been obtained from third party sources without verification) is believed by S3 Partners, LLC (“S3 Partners”) to be reliable and accurate. Neither S3 Partners nor any of its affiliates makes any representation as to the accuracy or completeness of the information herein or accepts liability arising from its use. Prior to making any decisions based on the information herein, you should determine, without reliance upon S3 Partners, the economic risks, and merits, as well as the legal, tax, accounting, and investment consequences, of such decisions.