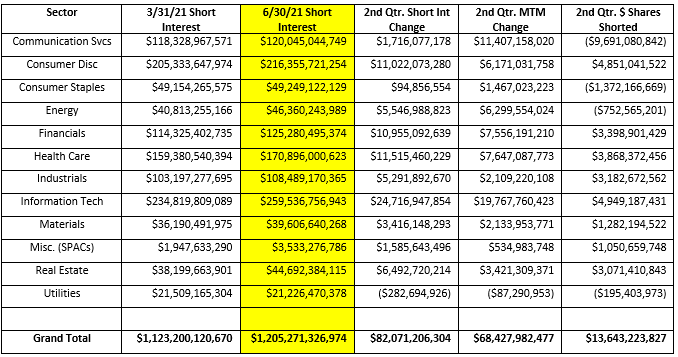
Short interest in the domestic market increased by +$82.1 billion, or +7.31%, to $1.21 trillion in the second quarter of 2021. With the overall market rallying, the majority of this increase, +$68.4 billion, came from mark-to-market appreciation of the shorted securities, but there was also +$13.6 billion of additional short selling in the quarter.
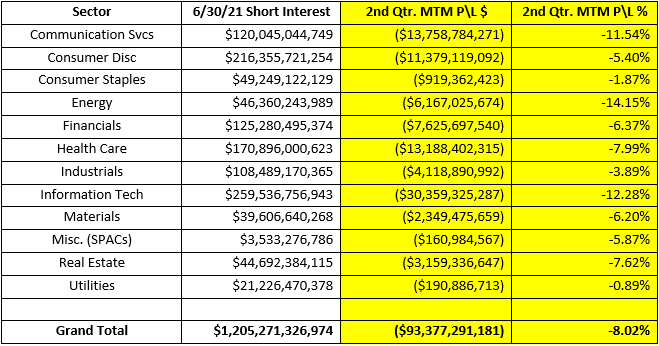
The sectors with the largest increase in short exposure were Information Technology (+$25 billion), Health Care (+$12 billion), Consumer Discretionary (+$11 billion) and Financials (+$11 billion). The only sector that had a reduction in short exposure over the 2nd quarter was the Utilities sector which was down slightly (-$283 million).
Short exposure continues to be concentrated in several sectors: Information Technology ($260 billion), Consumer Discretionary ($216 billion) and Health Care ($171 billion).
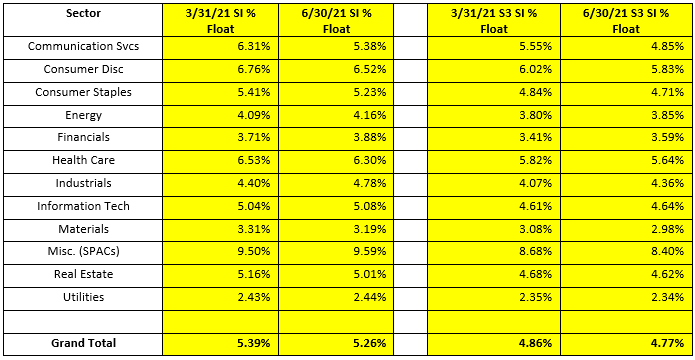
Short Interest as a % of Float did not change appreciable in the 2nd quarter, decreasing just -13 bps from 5.39% to 5.26%. But there were several sectors with some movement. The Industrial sector had a 0.29% increase in SI % Float to 4.36% and on the downside Communication Services fell -0.70% to 4.85%. The Miscellaneous (primarily SPACs) sector has the largest SI % Float at 9.59% and Consumer Discretionary (6.52%) and Health Care (6.30%) were the only two other sectors over 6%.
The S3 SI % Float, which includes the synthetic long shares created by every short sale in the denominator, fell 9 bps over the quarter, from 4.86% to 4.77%.
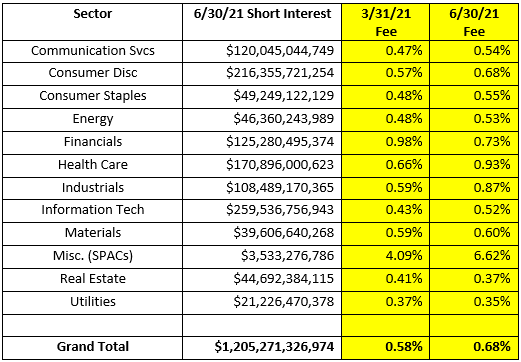
It became more expensive, on average to short stocks in the 2nd quarter as the average stock loan fee rose 10 bps from 0.58% fee to 0.68% fee. Due to the proliferation of SPAC short selling stock loan rates in the Miscellaneous sector increased 253 bps from 4.09% to 6.62% fee, mainly because of the limited stock loan availability in most SPAC securities.
Overall short sellers paid $2.07 billion in stock borrow fees in the 2nd quarter of 2021 (calculated daily borrow cost using S3’s offer rate) versus $2.01 billion in stock borrow expenses in the 1st quarter of 2021. Nine stocks made up a fifth of the total domestic equity stock borrowing costs for the quarter: SOFI -$82mm, UPST -$81mm, BLNK -$45mm, ARVL -$40mm, CCIV -$39mm, LAZR -$36mm, AMC -$31mm, PATH -$29 and SKLZ -$26mm.
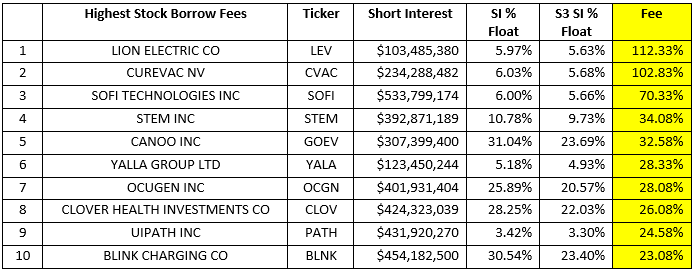
High stock borrow fees can test the conviction level of short sellers as financing costs can take a large bite out of expected Alpha. The highest stock borrow fees, as of June 30th, for stocks with over $100 million of short interest were:
Short sellers were down -$93.4 million in 2nd quarter mark-to-market losses, -8.02%. With the Russell 3000 up +7.89% for the quarter, short sellers underperformed the market by -0.13%.
There were 7,666 shorted equities with positive P\L, producing +$29.5 billion in profits, +9.60%. The largest short-side winners in the 1st quarter were: ABNB +$913mm. TAL +$449mm, DISCA +$447mm, GOTU +$421mm and INTC +$392mm.
There were more unprofitable shorts than profitable shorts in the 2nd quarter but not to the extent we saw in the 1st quarter with 9,226 securities in total, producing -$122.9 billion of losses, -14.28%. The largest short-side losers in the 1st quarter were AMC -$4,380mm, NVDA -$1,876mm, AAPL -$1,835mm, AMZN -1,810mm and MSFT -$1,809mm.
Our Blacklight SaaS platform and Black App provides an up to date view of short selling and short covering on an equity, sector, index, or country-wide basis allowing investors\traders to better manage their existing long and short positions.
Research Note written by Ihor Dusaniwsky, Managing Director of Predictive Analytics, S3 Partners, LLC
For deeper insight into short side data and analysis contact me at Ihor.Dusaniwsky@S3Partners.com
For short side data and access to our research reports go to https://shortsight.com/ .
Click for 10 Day Complimentary Access to Bloomberg/S3 Black App Pro
The information herein (some of which has been obtained from third party sources without verification) is believed by S3 Partners, LLC (“S3 Partners”) to be reliable and accurate. Neither S3 Partners nor any of its affiliates makes any representation as to the accuracy or completeness of the information herein or accepts liability arising from its use. Prior to making any decisions based on the information herein, you should determine, without reliance upon S3 Partners, the economic risks, and merits, as well as the legal, tax, accounting, and investment consequences, of such decisions.