We follow 11,433 Asia – Oceania stocks with short interest with an aggregate market cap of $54.4 trillion and short interest of $273 billion. Short selling in these stocks is highly concentrated, with the top thirty most shorted stocks making up 26% of the total shorts in the region.

Both the iShares MSCI All Country ASI ETF (AAXJ) and the iShares MWCI Japan ETF (EWJ) are up for the year which has been a factor in the increased the value of the shares shorted in the region. The following are the stocks in the region with the greatest increase in short exposure over the last thirty days.

Changes in a stock’s short interest are made up of mark-to-market price moves and either short selling or short covering activity. The following stocks had the largest increase in short selling activity over the last thirty days.

And the following stocks had the largest amount of short covering over the last thirty days.
 ‘
‘
High Short Interest as a % of Float is a factor in the “crowdedness” of a shorted stock. Higher numbers can have negative effects on stock loan liquidity as well as trading liquidity. The following are stocks with highest SI % Float and short interest over $50 million. The average SI % of Float in Asia – Oceania is 4.70%, and as a comparison the average U.S. SI % Float is 5.47%.

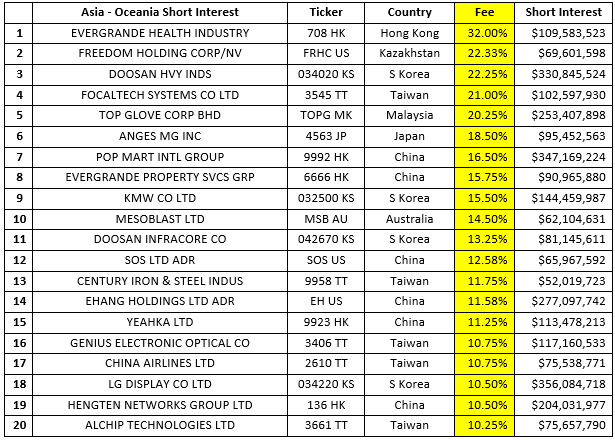
Stock borrows fees in Asia – Oceania have been, on average, higher than those in the U.S. with the average stock borrow fee in Asia at 1.29% fee versus 0.71% in the U.S.. Increased short side financing costs are an indication of short conviction in a shorted stock as the projected Alpha of the trade must be substantial to offset the financing costs incurred. The highest stock borrow fees in Asia – Oceania for stocks with over $50 million of short interest are:

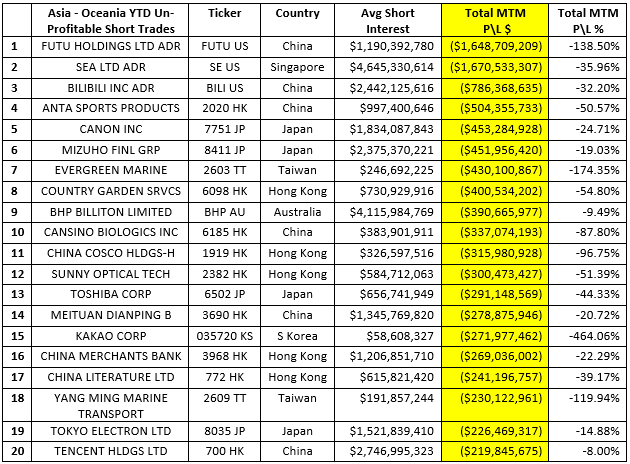
Overall, Asian – Oceanian short sellers are down -$14.44 billion in net of financing mark-to-market losses for the year. A return of -5.06% on an average short interest of $285 billion. The following are the top twenty largest winners and losers for the year.


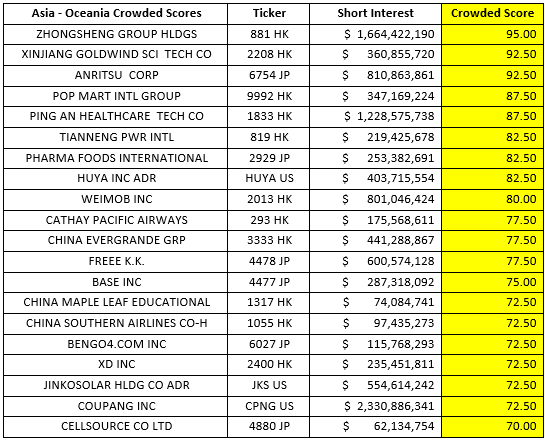
The definition of a “crowded” short trade varies from investor to investor but there are several themes that remain constant. A short can be considered to be “crowded” if some or all of the following occur: there are large amount of dollars at risk on the short side, a large proportion of a stock’s float is being shorted, there is illiquidity in the stock loan market and\or there is illiquidity in the trading market. The most crowded Asia – Oceania stocks with over $50 million of short interest, according to our Crowded Score, are:

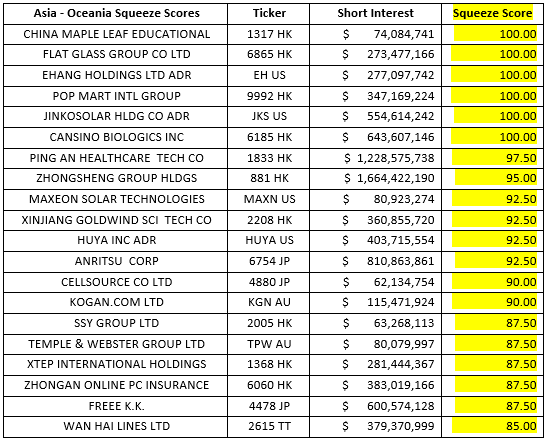
Not every Crowded stock is a Squeeze candidate. By overlaying our Squeeze algo over our Crowded stock results we can determine which Asia – Oceania stocks have the highest potential for a Squeeze, and which do not. The following have earned our highest Squeeze Scores, which does not mean a Squeeze will actually occur, but means that if the present trends continue, there is a good chance for a Squeeze.

Looking at short selling trends over time provides insight into overall market sentiment as well as the strength of bearish conviction in individual equities. Our Blacklight SaaS platform and Black APP provides an up to date view of short selling and short covering on an equity, sector, index, or country-wide basis allowing investors\traders to better manage their existing long and short positions.
Research Note written by Ihor Dusaniwsky, Managing Director of Predictive Analytics, S3 Partners, LLC
For deeper insight into short side data and analysis contact me at Ihor.Dusaniwsky@S3Partners.com
For short side data and access to our research reports go to https://shortsight.com/ .
Click for 10 Day Complimentary Access to Bloomberg/S3 Black App Pro
The information herein (some of which has been obtained from third party sources without verification) is believed by S3 Partners, LLC (“S3 Partners”) to be reliable and accurate. Neither S3 Partners nor any of its affiliates makes any representation as to the accuracy or completeness of the information herein or accepts liability arising from its use. Prior to making any decisions based on the information herein, you should determine, without reliance upon S3 Partners, the economic risks, and merits, as well as the legal, tax, accounting, and investment consequences, of such decisions.