There are 2,693 ETFs and Funds with active shares shorted in our Blacklight SaaS platform and Black App with $256 billion of short interest. Average Short Interest % of Float is 20.63% and S3 SI % Float (which includes synthetic longs created by every short sale in the Float number) is 15.42%, while the average stock borrow fee is 0.76%. As a comparison, U.S. equites have an average SI % Float of 5.39%, S3 SI % Float of 4.87% and average stock borrow fee of 0.70%.
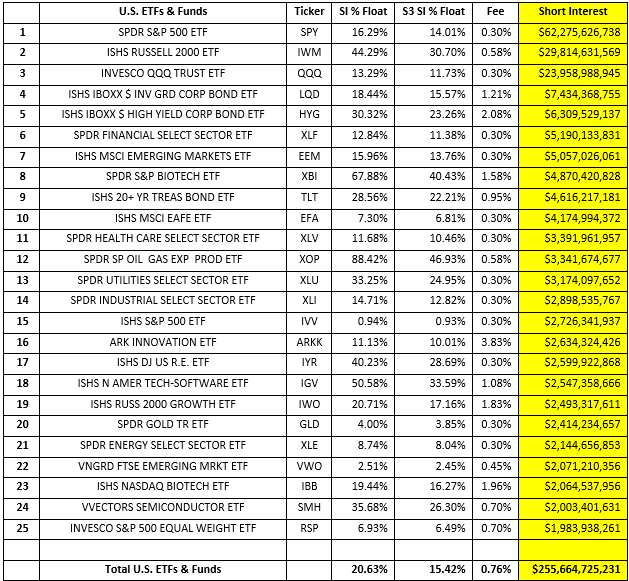
Overall ETF short exposure decreased from $258.9 billion to $255.7 billion, a decrease of -$3.2 billion or -1.2%, over the last 30 days. Change in short interest is comprised of mark-to-market price changes of existing shorts and short selling and covering. Over the last 30 days we saw a +$2.1 billion increase in the market-to-market value of existing short positions offset by -$5.3 billion of net short covering. ETF short sellers experienced an increase in exposure due to market strength but bought to cover ETF short positions to offset that increase. This indicates that ETF short sellers were looking to trim their exposure as the markets rose, either reducing their portfolio hedges or outright risk positions.
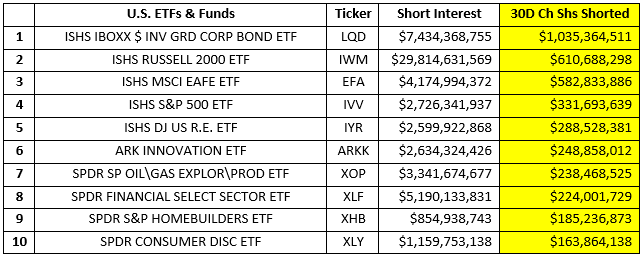
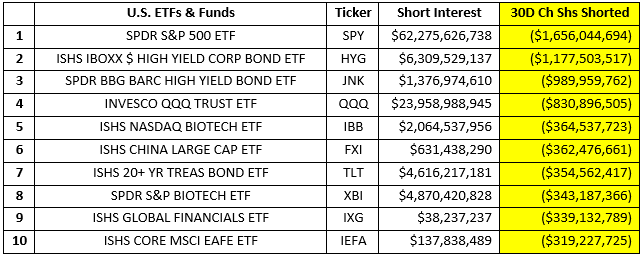
There was $5.3 billion of net ETF short covering over the last 30 days. We saw short selling in the investment grade corporate bond ETF LQD while short covering in the high yield corporate bond ETFs HYG and JNK along with the 20+ year treasury bond ETF (TLT). Short sellers were also building exposure in real estate (IYR), oil & gas exploration & production (XOP) and homebuilders (XHB). Shorts were seen trimming exposure to biotech (IBB & XBI), China (FXI) and financials (IXG).
ETF short interest as a % of Float is a much more fluid metric than it is for equities and ADRs as ETFs are constantly created and\or redeemed which changes their shares outstanding\float numbers sometimes on a daily basis. The following are ETFs with the highest SI % Float with overall short interest greater than $100 million.
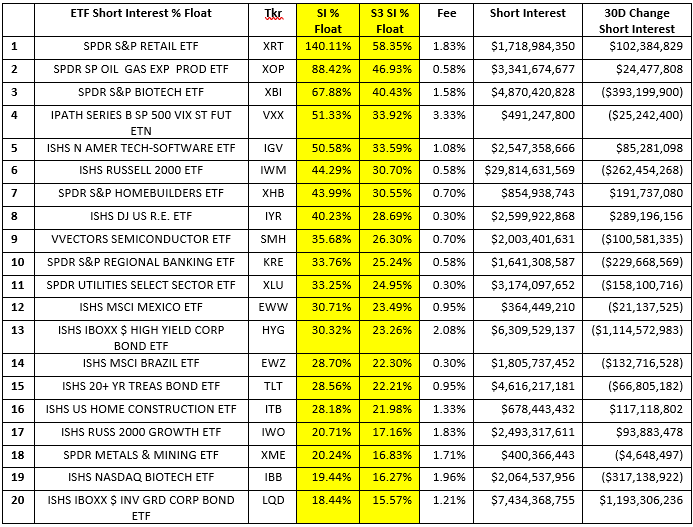
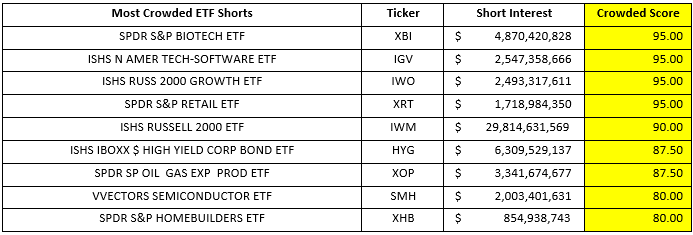
SI % Float is just one of the variables in our multi-factor Crowded Score along with the overall size of the short, stock borrow liquidity\costs and trading liquidity. The ETFs with the highest Crowded Scores are:
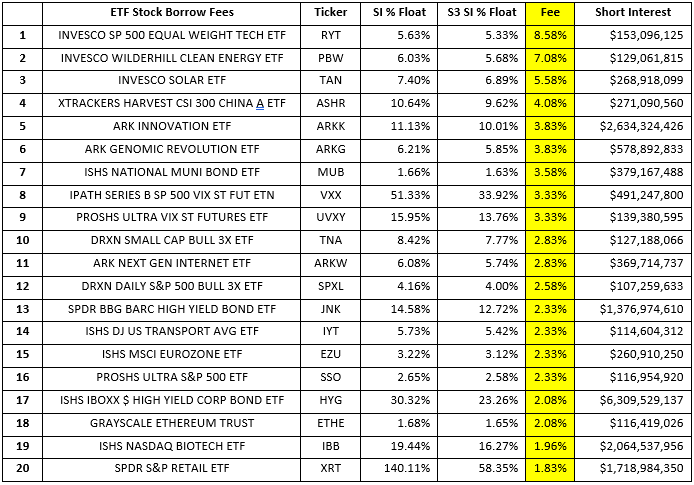
ETF stock borrow fees rarely get very expensive (over 5% fee) as brokers will usually create ETF shares in order to meet stock borrow demand as rates make the share creation and hedging profitable. Rates in certain ETFs tend to climb for two main reasons, there is very little marginable or rehypothicatable stock in the market which limits the stock lending availability pool or the process of creating and hedging the ETF is difficult or very expensive (active ETFs or illiquid constituents) . The following are ETFs with the highest stock borrow fees with short interest over $100 million.
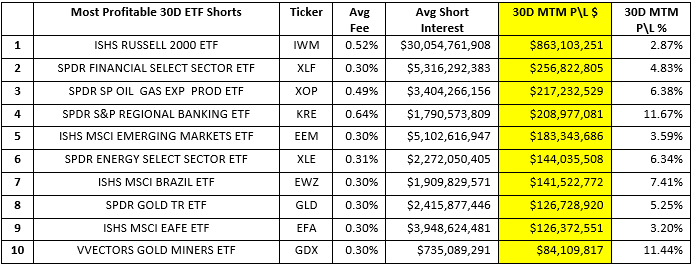
Institutionally ETFs are primarily used as a portfolio hedging vehicles (SPY, IWM & QQQ shorts make up 45% of total ETF short interest) so one can expect that in an upward trending market most of the larger ETF short positions would have negative returns. ETF shorts were down -$2.27 billion in net-of financing mark-to-market losses, -0.87%, over the last 30 days. The following are the most and least profitable ETF shorts over the last 30 days.
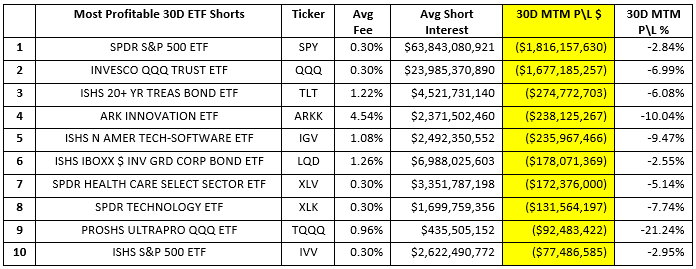
The ARKK ETF continues to be a very active short recently while the ARKG ETF has seen short covering over the last 30 days. Overall, there is $3.77 billion of short exposure in ARK ETF’s with $72 million of new short selling in the group over the last 30 days.

Looking at short selling trends over time provides insight into overall market sentiment as well as the strength of bearish conviction in individual equities. Our Blacklight SaaS platform and Black APP provides an up to date view of short selling and short covering on an equity, sector, index, or country-wide basis allowing investors\traders to better manage their existing long and short positions.
Research Note written by Ihor Dusaniwsky, Managing Director of Predictive Analytics, S3 Partners, LLC
For deeper insight into short side data and analysis contact me at Ihor.Dusaniwsky@S3Partners.com
For short side data and access to our research reports go to https://shortsight.com/ .
Click for 10 Day Complimentary Access to Bloomberg/S3 Black App Pro
The information herein (some of which has been obtained from third party sources without verification) is believed by S3 Partners, LLC (“S3 Partners”) to be reliable and accurate. Neither S3 Partners nor any of its affiliates makes any representation as to the accuracy or completeness of the information herein or accepts liability arising from its use. Prior to making any decisions based on the information herein, you should determine, without reliance upon S3 Partners, the economic risks, and merits, as well as the legal, tax, accounting, and investment consequences, of such decisions.