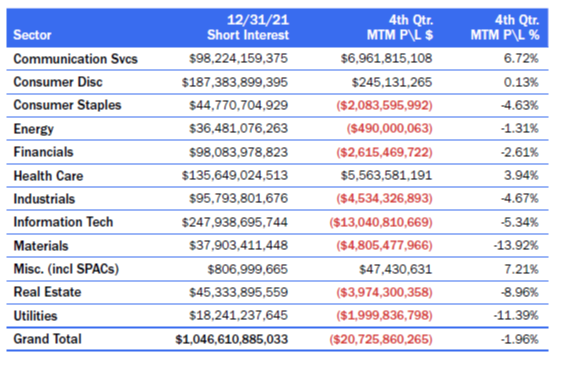
Short interest in the domestic market decreased by -$23.9 billion, or -2.23%, to $1.05 trillion in the fourth quarter of 2021. The decrease in shares shorted was a reaction to an up-trending market in the fourth quarter (S&P 500 up +10.65%, Nasdaq up +8.28% and Russell 3000 up +8.92%). Most of this decrease, -$38.2 billion, came from short covering, which was offset by +$14.2 billion of mark-to-market increases in short interest. Short sellers decreased their bets as mark-to-market losses negatively affected their bottom lines in the final leg to year-end.
The sectors with the largest decrease in short exposure were Health Care (-$11.06 billion), Consumer Discretionary (-$10.75 billion) and Communication Services (-$10.71 billion). Both Health Care and Consumer Discretionary were two of the three sectors with the largest decreases in the third quarter as well. Only two sectors had significant increases in short exposure in the third quarter, short interest in the Information Technology sector was up +$7.27 billion and Materials sector up +$6.76 billion.
Short exposure continues to be concentrated in several sectors: Information Technology ($248 billion), Consumer Discretionary ($187 billion) and Health Care ($136 billion).
Short Interest by Sector: Fourth Quarter 2021

Market wide, Short Interest as a % of Float continued to decline in the fourth quarter, decreasing by -36 bps from 5.17% to 4.81%. But there were several sectors with larger-than-average declines as short sellers not only covered some of their exposure but reallocated their positions to larger cap securities in the sectors. The Materials sector had a -0.81% decrease, Information Technology a decrease of -0.52% and the Industrial sector a -0.51% decline. The Miscellaneous area (primarily SPACs) was the only sector with a large upward move in SI % Float at +2.58%.
The S3 SI % Float, which includes the synthetic long shares created by every short sale in the denominator, fell -30 bps over the quarter, from 4.67% to 4.37%.
Traditional Short Interest as a % of Float versus S3 Short Interest as a % of Float

Short sellers found it slightly cheaper, on average, to short stocks in the fourth quarter with the average stock loan fee falling -13 bps from 0.69% fee to 0.56% fee. The trend to short larger-cap stocks (which reduced overall SI % Float) also reduced stock borrow expenses because of the significant stock borrow supply in these larger cap names. Due to the limited stock borrow availability, SPAC stock loan rates in the Miscellaneous sector continued to be the most expensive sector to short, with rates rising +1911 bps from 3.43% to 22.54%. The outsized jump in average financing expense in the sector is mainly due to the high cost of shorting the largest short in the sector, Digital World Acquisition Corp (DWAC), which has a 86.07% fee.
Borrow Fee by Sector

Overall short sellers paid $1.72 billion in stock borrow fees in the fourth quarter of 2021 (calculated daily borrow cost using S3’s offer rate) versus $1.86 billion in stock borrow expenses in the third quarter of 2021. The ten stocks that short sellers had the most conviction and paid the most to short made up 23% of the total borrow cost in the quarter. These names were: HOOD (-$144mm), BKKT (-$65mm), DNA (-$30mm), MVST (-$30mm), DIDI (-$27mm), FFIE (-$22mm), TSLA (-$20mm), VMW (-$19mm), BTBT (-$19mm) and GRAB (-$18mm).
Even after paying $144 million in stock borrow financing costs, Robinhood Markets Inc (HOOD) short sellers still ended up +$398 million in net-of-financing profits, up +52.42% for the quarter. But sometimes high financing costs can turn a winner into a loser. BAKKT Holdings Inc (BKKT) shorts paid $65 million in stock borrow costs, which turned $62 million in mark-to-market profits into a net -$3 million loser, -2.06% for the quarter. The same can be said for Microvast Holdings Inc (MVST) where short sellers paid $30 million in stock borrow costs, earned $24 million in mark-to-market profits, but ended up with -$6 million net-of-financing mark-to-market losses, -5.32% for the quarter.
High stock borrow fees can test the conviction level of short sellers as financing costs can take a large bite out of expected alpha. As of December 31, the highest stock borrow fees for stocks with over $100 million of short interest are presented below.
Stocks with the Highest Stock Borrow Fees: As of 12/31

Short sellers were down -$20.7 billion in fourth quarter mark-to-market losses, -1.96%. With the Russell 3000 up +8.92% for the quarter, short sellers outperformed the market significantly by being good stock pickers.
There were 6,521 shorted equities with positive P\L, producing +$62 billion in mark-to-market profits, +14.8%. The five largest short-side winners in the fourth quarter were: SQ (+$3.16bn), SE (+2.12bn), MRNA (+$1.96bn), SNAP (+$1.27bn) and PTON (+$1.17bn).
There were 6,150 shorted equities with negative P\L, producing -$83 billion in mark-to-market losses, -12.26%. The five largest short-side losers in the fourth quarter were: TSLA (-$8.05bn), AAPL (-$3.37bn), AMD (-$2.64bn), MSFT (-$2.54bn) and NVDA (-$1.57bn).
There were slightly more profitable shorts than unprofitable shorts in the fourth quarter with 39% of all short positions adding positive numbers to a trader’s bottom lines, 37% with negative numbers and 24% were flat for the quarter.
The most profitable sectors on the short side were Communication Services (+6.72%) and Miscellaneous\SPACs (+7.21%), while the least profitable shorted sectors were Materials (-13.92%) and Utilities (-11.39%).
Short Shelling Profitability by Sector
