Rocket Companies Inc (RKT) is rallying for the third consecutive day and is up +43.3% in less than three full trading days. RKT’s recent stock price surge has it trending towards its 2020 high of $31.31/share. We are seeing both exceptionally high trading and option volumes in the stock.
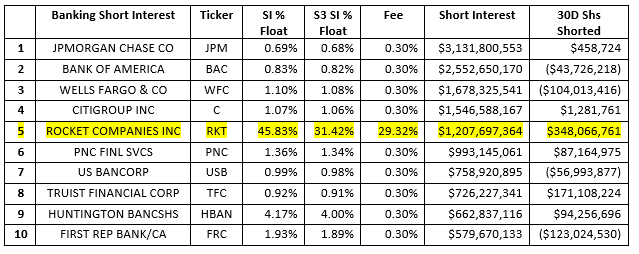
In addition to the large amount of trading volume we have also seen a large amount of short selling into this rally. Short sellers have been active over the last 30 days, with almost $350 million of new short selling hitting the tape, and $92 million of short selling in the last 7 days. RKT short interest is $1.21 billion; 49.70 million shares shorted; 45.83% SI % Float; 31.42% S3 SI % Float (which includes synthetic longs along with Float); 29.3% stock borrow fee on existing shorts and new shorts are paying over 75% fee.
RKT is the fifth largest short in the Banking sector, behind the Mega and Large cap behemoths in the sector.

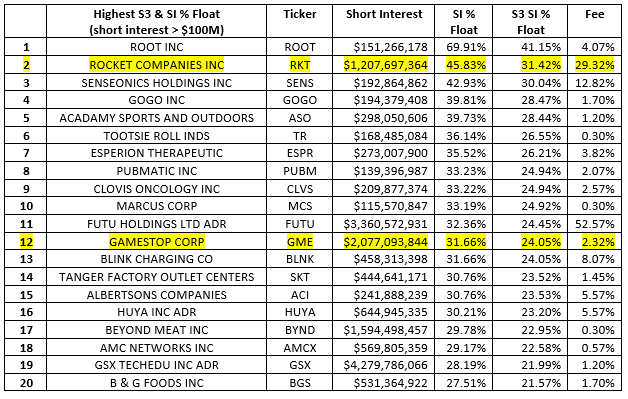
RKT’s stock price and short selling activity is reminiscent of another recent high flying meme stock – Gamestop Inc (GME). Both stocks saw their share price spike due to high retail buying interest (predominantly due to significant social media activity) and an options based gamma squeeze. Both stocks also had\have relatively high short interest and high stock borrow rates which imply strong short selling demand and very limited stock borrow supply. RKT has the second largest S3 & SI % Float while GME is still in the top twenty, coming in at #12.

RKT is one of our top short squeeze candidates with short sellers down -$484 million in year-to-date net-of-financing mark-to-market losses, -57% for the year, including down -$256 million on today’s +21% move. If the stock continues to rally, we should see some of the existing shorts getting a tap on the shoulder from their Risk Officers and forced to close their short positions.
But in a Gamestock-esque twist, as old shorts buy-to-cover, we are seeing new shorts building short positions as stock borrows become available. We can see this in the recent moves in RKT’s stock borrow rates. High short selling demand and limited stock loan supply are spiraling stock borrow rates upwards. If shorts were buying-to-cover and no other shorts were entering the trade, stock borrow rates would be declining as demand declines and supply increases, basic Econ 101. So, since there has been no appreciable change in RKT stock loan supply, the reason for RKT’s stock borrow rates climb is increased stock loan demand which means that RKT short sellers are still active.
We once again are seeing a long buying vs short selling battle. But in addition to the Reddit based buying activity we are seeing in both the equity and call option markets; we are also seeing value investors buying RKT stock based on their better than expected 1st quarter guidance and strong mortgage activity. Short sellers may be outnumbered and out gunned in this battle and the short squeeze may come sooner rather than later.
Other stocks that we strong short squeeze potential are ViacomCBS Inc (VIAC), Discovery Inc (DISCA), AMC Networks Inc (AMCX), Matador Resources (MTDR), Norwegian Cruise Lines (NCLH), Avis Budget Group (CAR) and Carvana Inc (CVNA). There does not seem to be a scarcity of potential long vs short battles.
Looking at short selling trends over time provides insight into overall market sentiment as well as the strength of bearish conviction in individual equities. Our Blacklight SaaS platform and Black APP provides an up to date view of short selling and short covering on an equity, sector, index, or country-wide basis allowing investors\traders to better manage their existing long and short positions.
Research Note written by Ihor Dusaniwsky, Managing Director of Predictive Analytics, S3 Partners, LLC
For deeper insight into short side data and analysis contact me at Ihor.Dusaniwsky@S3Partners.com
Click for 10 Day Complimentary Access to Bloomberg/S3 Black App Pro
The information herein (some of which has been obtained from third party sources without verification) is believed by S3 Partners, LLC (“S3 Partners”) to be reliable and accurate. Neither S3 Partners nor any of its affiliates makes any representation as to the accuracy or completeness of the information herein or accepts liability arising from its use. Prior to making any decisions based on the information herein, you should determine, without reliance upon S3 Partners, the economic risks, and merits, as well as the legal, tax, accounting, and investment consequences, of such decisions.