There are 2,769 ETFs and Funds with active shares shorted in our Blacklight SaaS platform and Black App with $254 billion of short interest. Average Short Interest % of Float is 20.25% and S3 SI % Float (which includes synthetic longs created by every short sale in the Float number) is 14.95%, while the average stock borrow fee is 0.81%. As a comparison, U.S. equities have an average SI % Float of 5.10%, S3 SI % Float of 4.60% and average stock borrow fee of 0.67%.
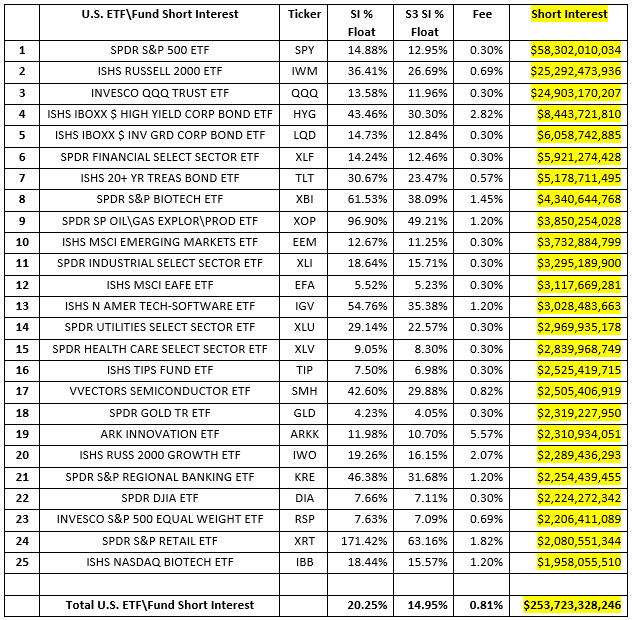
Overall ETF short exposure decreased from $270.2 billion to $253.7 billion, a decrease of -$16.5 billion or -6.1%, over the last 30 days. Change in short interest is comprised of mark-to-market price changes of existing shorts and short selling and covering. Over the last 30 days we saw a -$9.2 billion decrease in the market-to-market value of existing short positions and -$7.3 billion new net short covering. ETF short sellers experienced a decrease in exposure due to market weakness and also cut their short positions even as the market was declining. This indicates that ETF short sellers were looking to reduce to their exposure as the markets dropped, either decreasing their outstanding hedges or putting on less short risk (Alpha generating) positions.
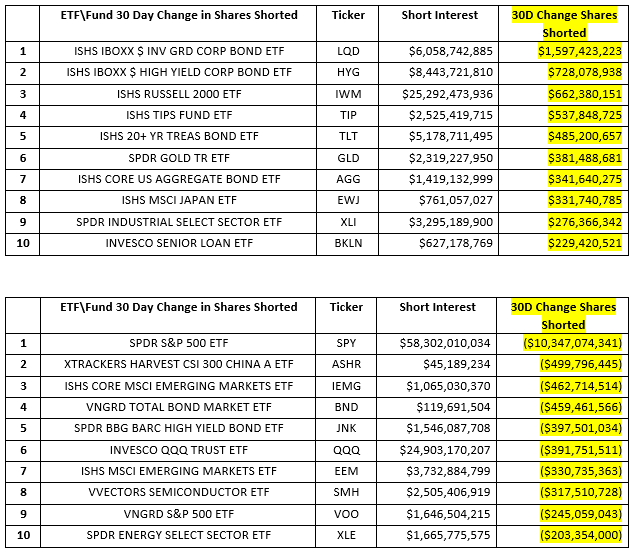
The $7.3 billion of net ETF short selling over the last 30 days had big movers in both directions. The “hedging ETFs” had large moves in the short side over the last 30 days with the SPDR S&P 500 ETF (SPY) had $10.3 billion of short covering along with $392 million of short covering in the Invesco QQQ Trust ETF (QQQ). The iShares Russell 2000 ETF (IWM) was on the other side of the coin with $662 billion of new short selling. These moves imply that portfolio managers were looking for weakness in the bigger cap and more technology focused SPY and QQQ ETFs while looking for strength in the broader market reflected in the IWM ETF.
Additionally, we saw increased short selling in fixed income ETFs with the iShares iBoxx $ Inv Grade Corp Bond ETF (LQD), the iShares iBoxx $ High Yield Corp Bond ETF (HYG), the iShares Tips Fund ETF (TIP), the iShares 20+ Year Treasury Bond ETF (TLT), the iShares Core US Aggregate Bond ETF (AGG) and Invesco Senior Loan ETF making up six out of the top ten most shorted ETFs over the last 30 days with total new short selling of +$3.96 billion. There were a couple of bond ETFs in the top ten in short covering, the Vanguard Total Bond Market ETF (BND) and SPDR Bloomberg Barclays High Yield Bond ETF (JNK) had short covering of -$857 billion.
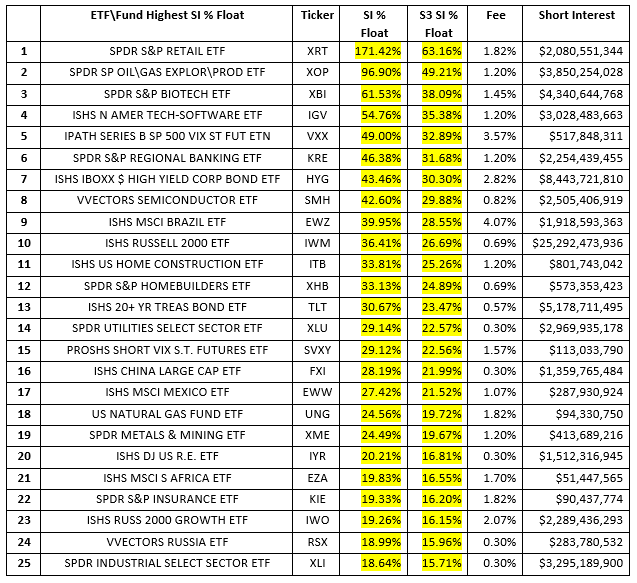
ETF short interest as a % of Float is a much more fluid metric than it is for equities and ADRs as ETFs are constantly created and\or redeemed which changes their shares outstanding\float numbers sometimes daily. The following are ETFs with the highest SI % Float with overall short interest greater than $50 million.
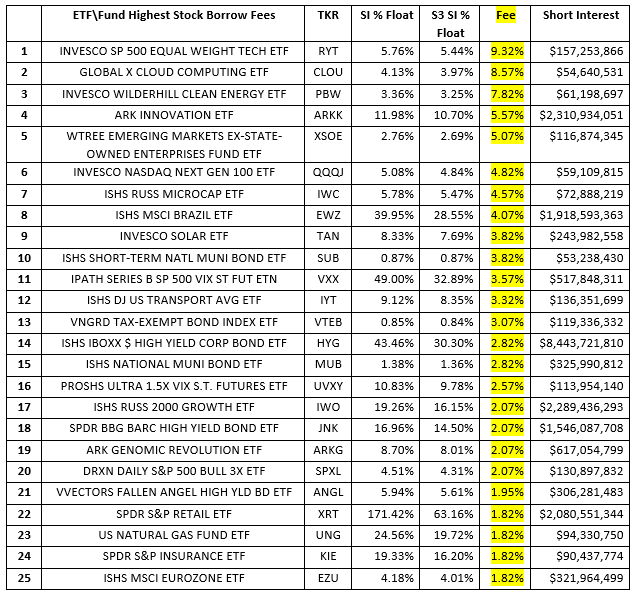
ETF stock borrow fees rarely get very expensive (over 5% fee) as brokers will usually create ETF shares in order to meet stock borrow demand as rates make the share creation and hedging profitable. Rates in certain ETFs tend to climb for two main reasons, there is very little marginable or rehypothicatable stock in the market which limits the stock lending availability pool or the process of creating and hedging the ETF is difficult or very expensive (active ETFs or ETF with illiquid constituents). The following are ETFs with the highest stock borrow fees with short interest over $50 million.
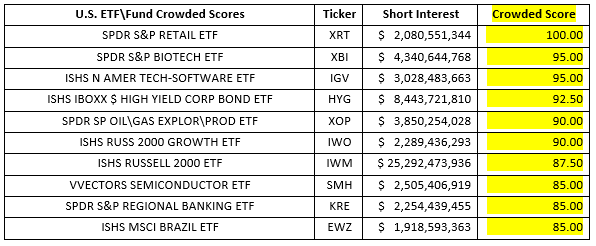
 SI % Float and stock borrow costs are just two of the variables in our multi-factor Crowded Score metric along with the overall size of the short, stock borrow liquidity and trading liquidity. The ETF\Funds with the highest Crowded Scores are:
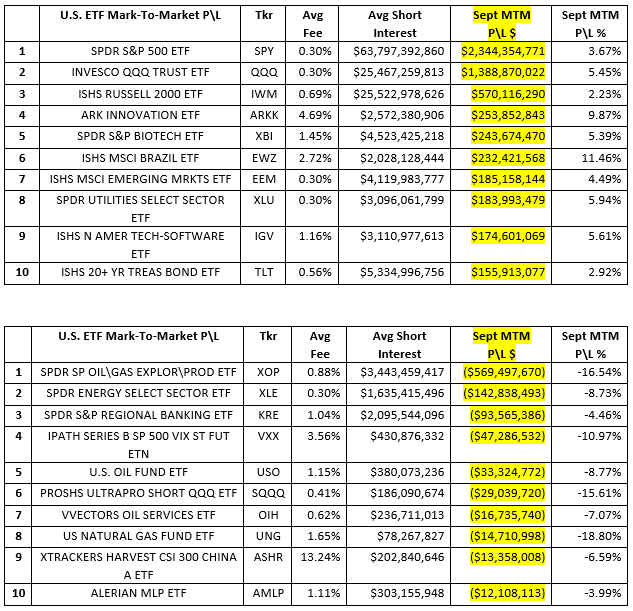
 Institutionally ETFs are primarily used as a portfolio hedging vehicles (SPY, IWM & QQQ shorts make up 43% of total ETF short interest) so one can expect that in a downward trending market most of the larger ETF short positions would have positive returns. ETF shorts were up +$8.4 billion in net-of financing mark-to-market profit, +3.19%, over the last 30 days. ETF\Fund short sellers made up 26% of their year-to-date mark-to-market losses in September with year-to-date losses cut to -$24.1 billion. The following are the most and least profitable ETF shorts in dollar terms in September.
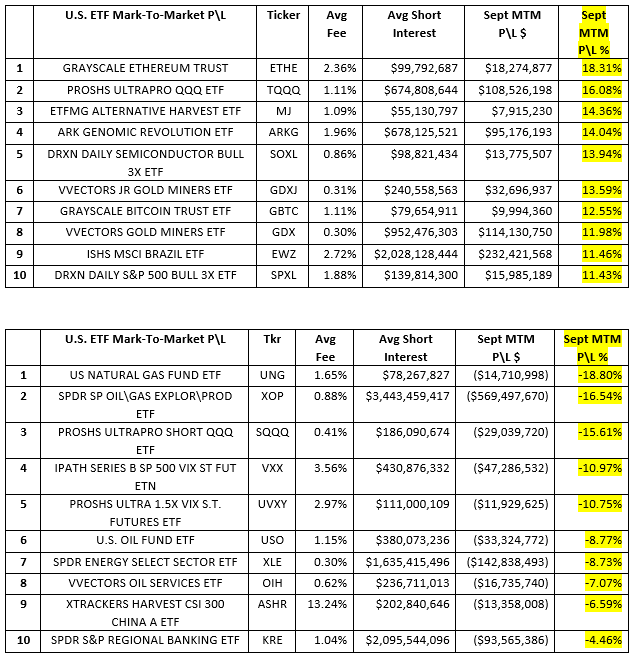
 The outright size of some ETF shorts can skew the results when looking at Profit & Loss in dollar terms, looking at Profit & Loss in percentage terms tells us which shorted ETFs had the largest price moves in September.
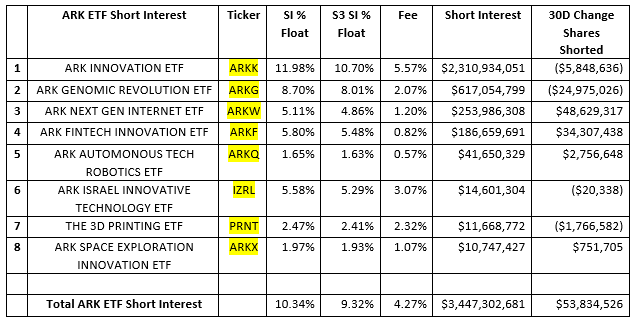
 Increased short selling in the ARKK family of ETFs has subsided over the last 30 days with only +$54 million worth of new short selling in aggregate and -$6 million of short covering in its most shorted ETF, the ARK Innovation ETF (ARKK).
There is $3.45 billion of short exposure in ARK ETFs. While the ARK family of ETF’s SI % Float is smaller than the average U.S. ETF their stock borrow fees are higher as stock borrow availability in these funds is limited. The scarcity of lendable shares is due to the lack of institutional holders and retail holdings primarily in fully-paid for accounts and not margin accounts which limits broker rehypothecation of internally held client assets.
 Looking at short selling trends over time provides insight into overall market sentiment as well as the strength of bearish conviction in individual equities. Our Blacklight SaaS platform and Black APP provides an up-to-date view of short selling and short covering on an equity, sector, index, or country-wide basis allowing investors\traders to better manage their existing long and short positions.
Research Note written by Ihor Dusaniwsky, Managing Director of Predictive Analytics, S3 Partners, LLC
For deeper insight into short side data and analysis contact me at Ihor.Dusaniwsky@S3Partners.com
For short side data and access to our research reports go to https://research.s3partners.com.