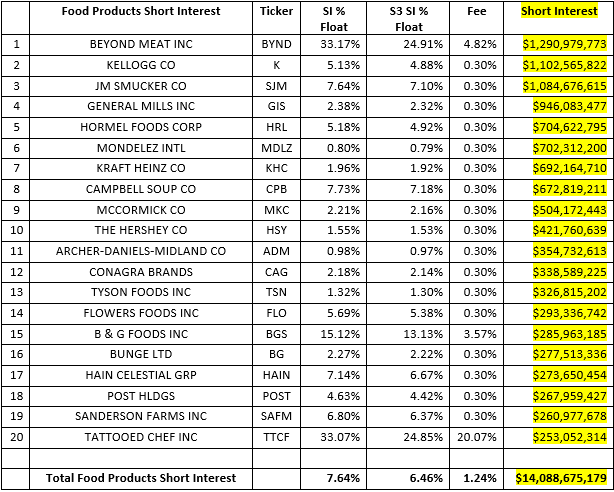
McDonald’s Corp’s (MCD) slogan in 2008 was “What we’re made of” and according to Piper Sandler part of that will be plant-based in 2022. Pipe Sandler announced that McDonald’s will be launching the Beyond Meat (BYND) McPlant Burger nationwide in the 1st quarter 2022.
BYND’s stock price jumped +9.3% on the news yesterday and short sellers took a $108 million mark-to-market loss on the stock price move. BYND’s short interest is $1.29 billion, 18.63 million shares shorted, 33.17% Short Interest % of Float, 24.91% S3 Short Interest % Float (which includes the long shares created by short selling in the float denominator), and a 4.82% stock borrow fee. BYND ids the largest short in the Food Products Industry Sector.
BYND short sellers have been very stock price reactive in 2022 with shares shorted plummeting as BYND’s stock price suddenly soared to its YTD high in late January and then short selling growing again until its stock price surged in May. After hitting a recent stock price high at the beginning of July short sellers increased their exposure as BYND’s stock price trended lower until the end of November when we once again saw BYND short covering.
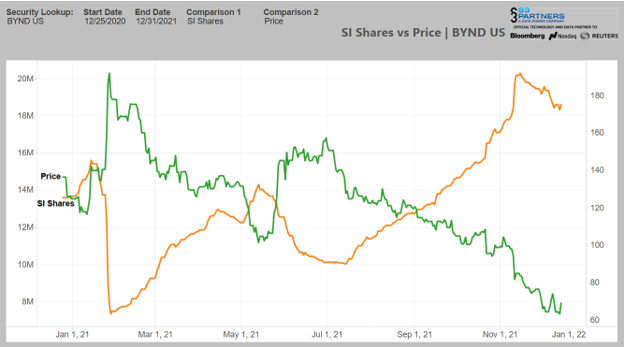
Over the last thirty days we saw 1.58 million shares of BYND shorts covered, worth $110 million. This was a -7.8% decline in BYND shares shorted even though its stock price fell -18.6%. Short covering has been steady recently, with 250 thousand shares covered over the last week, worth $17 million, a -1.3% decrease in shares shorted as BYND’s stock price fell -2.7%. Short sellers look to be trimming their positions as BYND’s stock price trades in $65 to $70 range.
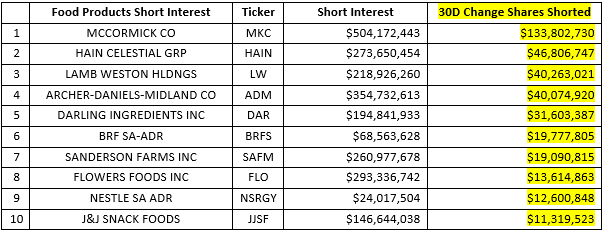
The Food Products stocks with the largest increase in short interest over the last thirty days are:
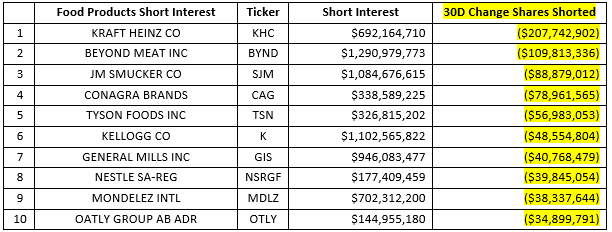
The Food Products stocks with the largest decrease in short interest over the last thirty days are:
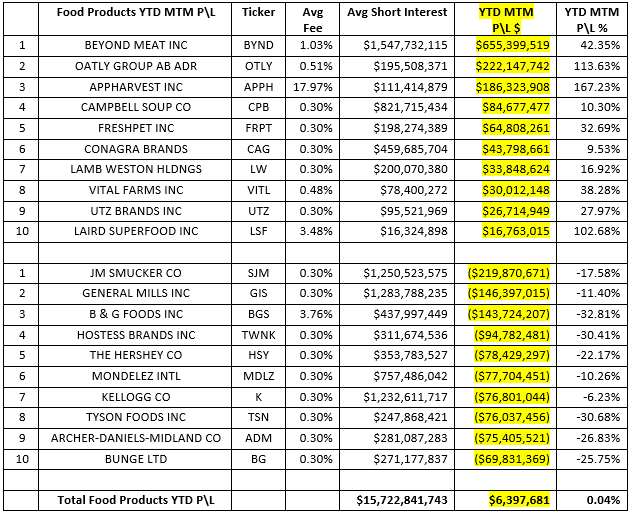
The Food Products sector was a stock pickers trade in 2021 with $5.1 billion of short trades in the sector earning $1.51 billion in profits, for a year-to-date mark-to-market return of +29.50%, and the remaining $10.6 billion of short trades incurring -$1.50 billion in losses, for a year-to-date mark-to-market return of -14.15%. Overall year-to-date mark-to-market profits totaled $6.4 million for a return of +0.04%.
The most and least profitable trades on a year-to-date basis are:
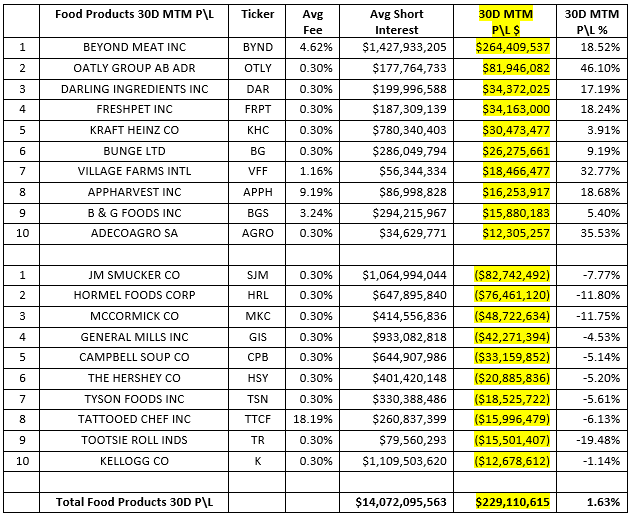
Profitability results in the Food Products sector were also mixed over the last thirty days. There were $5.97 billion of profitable trades over the last thirty-days earning $644 million in profits, for a thirty-day mark-to-market return of +10.79%, and the remaining $8.11 billion of short trades incurring -$415 million in losses, for a thirty-day mark-to-market return of -5.12%. Overall, thirty-day mark-to-market profits totaled $229 million for a return of +1.63%.
The most and least profitable trades over the last thirty-days are:
There are not many stocks that look to be squeezable in the Food Products sector primarily due to the fact that there are not many short positions suffering large mark-to-market losses. But there are several stocks, which due to their Crowded nature, that do fall in the squeezable stock range.
The highest Squeeze scores in the Food Products sector are:

Looking at short selling trends over time provides insight into overall market sentiment as well as the strength of bearish conviction in individual equities. Our Blacklight SaaS platform and Black APP provides an up-to-date view of short selling and short covering on an equity, sector, index, or country-wide basis allowing investors\traders to better manage their existing long and short positions.
Research Note written by Ihor Dusaniwsky, Managing Director of Predictive Analytics, S3 Partners, LLC
For deeper insight into short side data and analysis contact me at Ihor.Dusaniwsky@S3Partners.com
For short side data and access to our research reports go to https://research.s3partners.com .
Click for 10 Day Complimentary Access to Bloomberg/S3 Black App Pro
The information herein (some of which has been obtained from third party sources without verification) is believed by S3 Partners, LLC (“S3 Partners”) to be reliable and accurate. Neither S3 Partners nor any of its affiliates makes any representation as to the accuracy or completeness of the information herein or accepts liability arising from its use. Prior to making any decisions based on the information herein, you should determine, without reliance upon S3 Partners, the economic risks, and merits, as well as the legal, tax, accounting, and investment consequences, of such decisions.