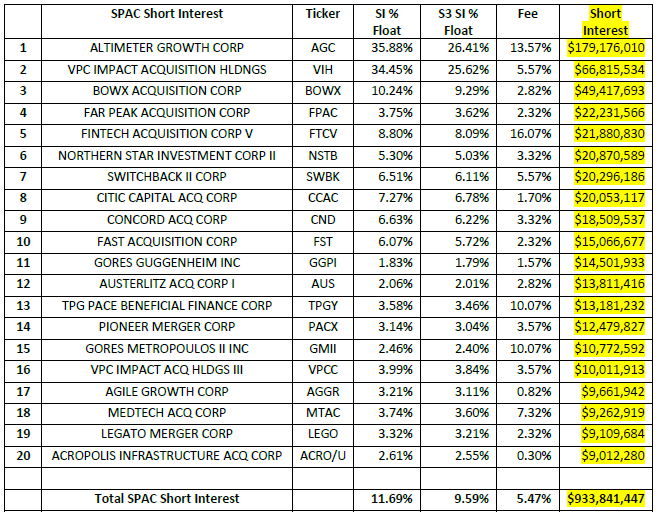
We follow 1,429 SPAC securities (equities and warrants) that have short interest on our Blacklight SaaS Platform and Black App. Total short interest in the SPAC sector has been declining over the past few months as large SPAC short positions such as Churchill Capital Corp IV (CCIV), Social Capital Hedosophia Holdings V (IPOE) and Switchback Energy Acquisition Corp (SBE) were de-SPACed. Total SPAC short interest has fallen below the $1 billion dollar level in September\October for the first time since the beginning of the year and is now $934 million, down over $2.5 billion from highs of over $3.5 billion in May.

SPAC average Short Interest % Float is 11.29% while the average S3 SI % Float of 9.59% (which includes the synthetic longs created by every short sale in the trade float denominator) with an average stock borrow fee of 5.47%. In contrast, stocks in the U.S. have a total short interest of $1.08 trillion, SI % Float of 5.21%, S3 SI % Float of 4.71% and an average stock borrow fee of 0.66%.
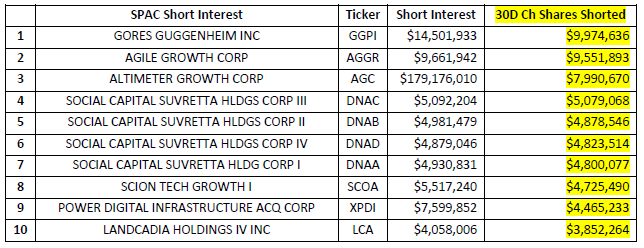
Total short interest in the SPAC sector has increased slightly from $902 million to $934 million over the last 30 days. This +$32 million decrease consisted of a -$12 million change in market value due to stock price declines offset by +$44 million of new short selling. As the value of their short SPAC holdings were decreasing, short sellers were generating mark-to-market profits and continuing to sell into the price weakness and increasing their short positions.
There were no SPAC securities with outsized short selling but there was a stream of short selling the Social Capital Suvrettta family of SPACs.

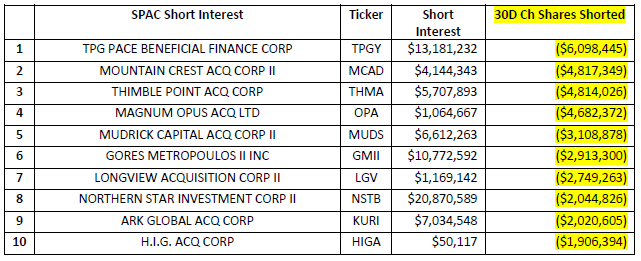
And SPAC short covering was also muted over the last thirty days:

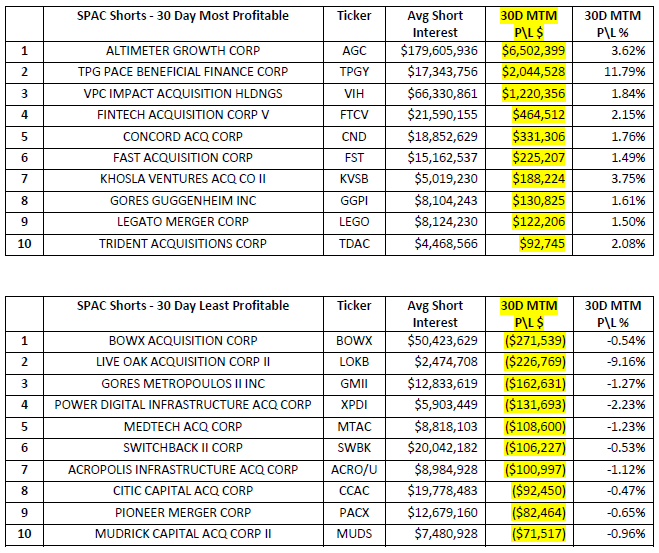
SPAC short sellers were up +$8 million, +0.90%, in net-of-financing mark-to-market profits over the last 30 days. Price volatility in the SPAC sector was minimal over the last thirty days with only 29% of the shorted SPAC securities profitable, up $12 million in mark-to-market profits, +2.90%. The 71% of unprofitable shorted SPAC stocks were down only -$3.5 million, -0.69%.

Looking at short selling trends over time provides insight into overall market sentiment as well as the strength of bearish conviction in individual equities. Our Blacklight SaaS platform and Black APP provides an up to date view of short selling and short covering on an equity, sector, index, or country-wide basis allowing investors\traders to better manage their existing long and short positions.
Research Note written by Ihor Dusaniwsky, Managing Director of Predictive Analytics, S3 Partners, LLC
For deeper insight into short side data and analysis contact me at Ihor.Dusaniwsky@S3Partners.com
For short side data and access to our research reports go to https://research.s3partners.com/.
Click for 10 Day Complimentary Access to Bloomberg/S3 Black App Pro
The information herein (some of which has been obtained from third party sources without verification) is believed by S3 Partners, LLC (“S3 Partners”) to be reliable and accurate. Neither S3 Partners nor any of its affiliates makes any representation as to the accuracy or completeness of the information herein or accepts liability arising from its use. Prior to making any decisions based on the information herein, you should determine, without reliance upon S3 Partners, the economic risks, and merits, as well as the legal, tax, accounting, and investment consequences, of such decisions.