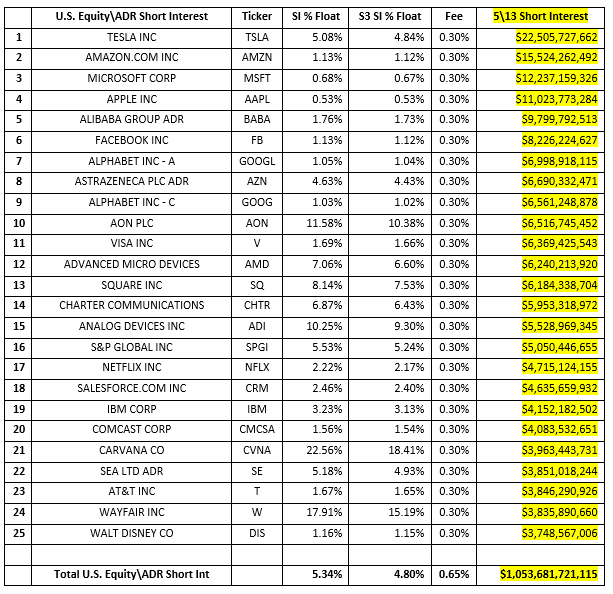
There are 13,741 equities and ADRs with active shares shorted in our Blacklight SaaS platform and Black App with $1.05 trillion of short interest. Average Short Interest % of Float is 5.34% and S3 SI % Float (which includes synthetic longs created by every short sale in the Float number) is 4.80% while the average stock borrow fee is 0.65%. The largest shorts are:
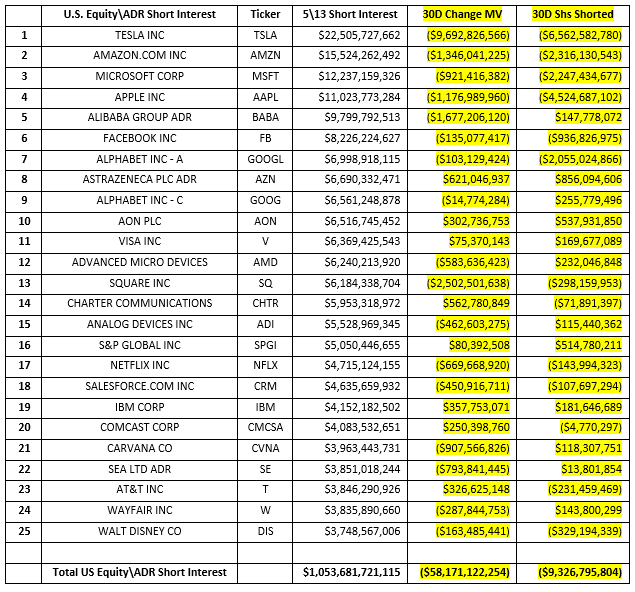
Overall equity\ADR short exposure decreased from $1.12 trillion to $1.05 trillion, a decrease of +$67.5 billion or -6%, over the last 30 days. Change in short interest is comprised of the mark-to-market price changes of existing shorts and short selling and covering. Over the last 30 days we saw a -$58.2 billion decrease in the market-to-market value of existing short positions coupled with -$9.3 billion of net short covering. Short sellers experienced a decrease in exposure due to market weakness and actively trimming their short positions. This indicates that they were not looking to increase their short exposure and may be looking for near-term strength in the market.
While changes in market value affects the risk profile of a portfolio it does affect not the underlying stock prices in that portfolio. Short selling and short covering actually move the market. The largest amount of short covering occurred in the tech sector and the stocks with the largest amount pf buy-to-covers over the last 30 days were TSLA, AAPL, AMZN, MSFT, GOOGL, MRVL, NVDA, FB, QCOM and MU.
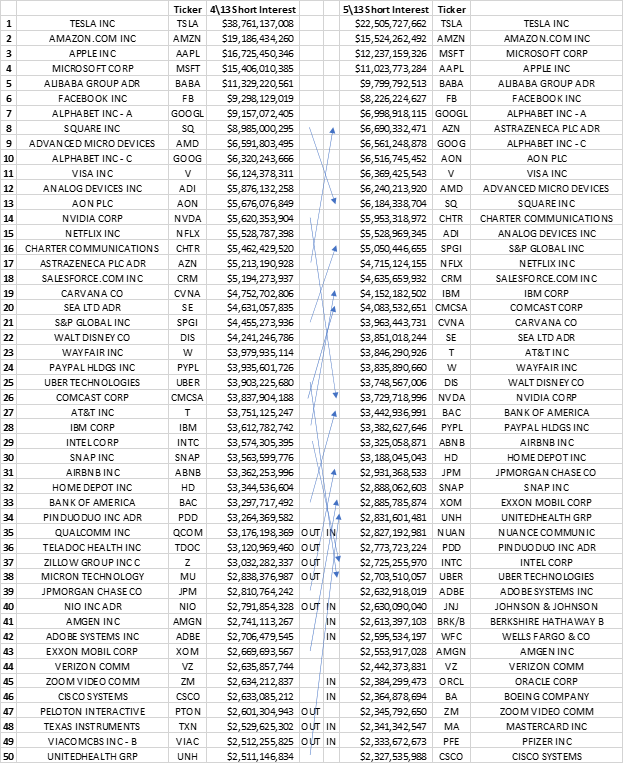
The previous chart shows movement in the top 50 Equity\ADR shorts since 4\13. Highlighted are securities which either gained or lost 5 spots in the short interest league table. As you can see, the largest shorts or the top third of the chart, do not have much movement but there is quite a bit of movement in shorted securities with less than $5 billion in short interest. Short side conviction is more fluid in the less shorted securities.
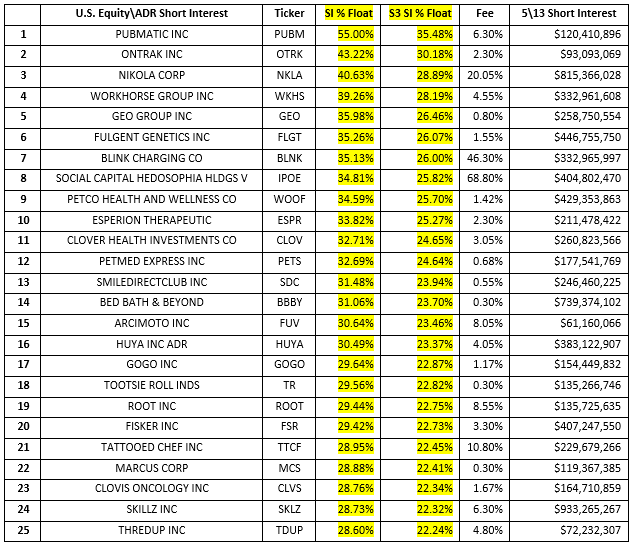
Short interest as a % of float and the S3 short interest % float (which includes the synthetic longs created by every short sale in the tradable float denominator) is one indicator of the crowdedness of a short relative to its market cap. The following are the Equities\ADRs with the largest SI % Float with short interest over $50 million.
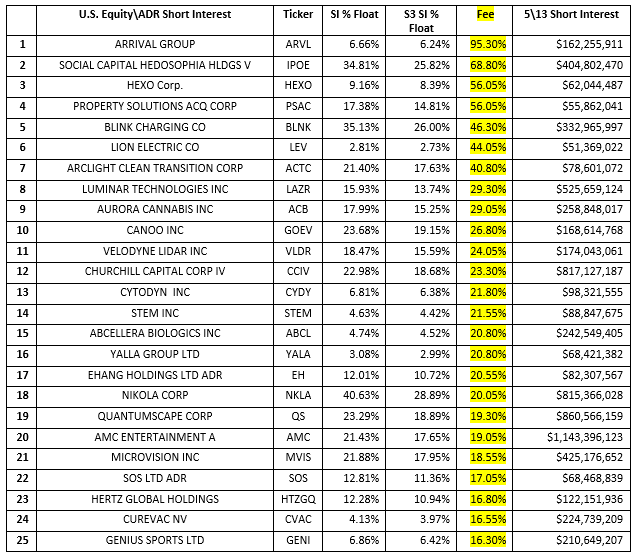
Stock borrow fees are a daily cost (including weekends!) that short sellers incur in order to keep their shorts open. Theses financing costs reduce expected Alpha and with 38% of all shorts having a stock borrow fee greater than or equal to 1.00% fee, they can tangibly affect the profitability of a short trade. The following are equities\ADRs with the highest stock borrow fees with short interest over $50 million.
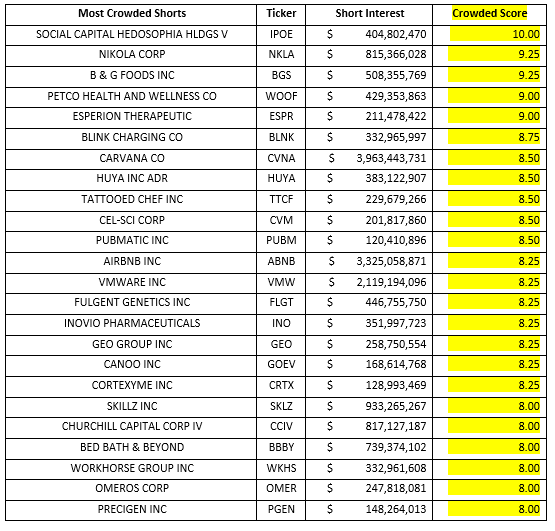
SI % Float and stock loan liquidity\cost are just two of the variables in our multi-factor Crowded Score along with the overall size of the short and trading liquidity. While the most crowded shorts all have higher than average Short Interest % of Float numbers, the remaining factors have a significant effect on our Crowded Score. The equity\ADR shorts with the highest Crowded Scores are:
With the broader market up for the year, the Russell 3000 is up over +10%, equity\ADR short sellers are understandably down for the year. Short sellers are down -$66.3 billion, -6.10%, in net-of-financing mark-to-market losses in 2021. The 2021 most and least profitable shorts are:
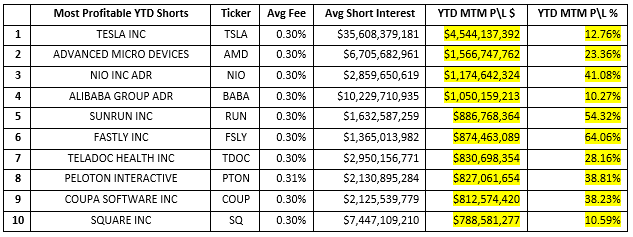
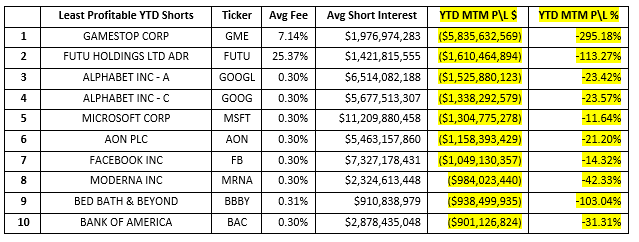
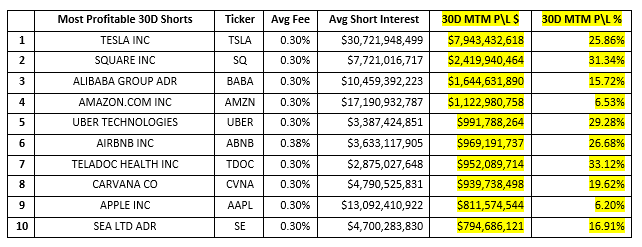
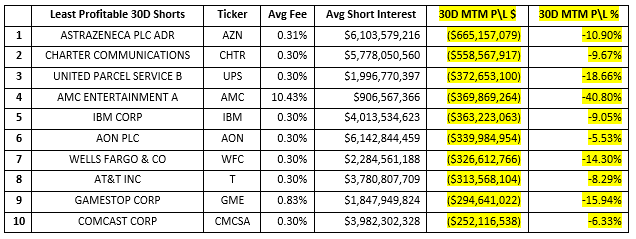
Over the last 30 days we saw weakness in the markets, the Russell 3000 down -1.4% and Nasdaq down -6.2%, equity\ADR short sellers were able to recoup a significant portion of their year-to-date losses in just one month. Short sellers were up +$55.0 billion, +4.97%, in net-of-financing mark-to-market profits over the last 30 days. The most and least profitable shorts are:
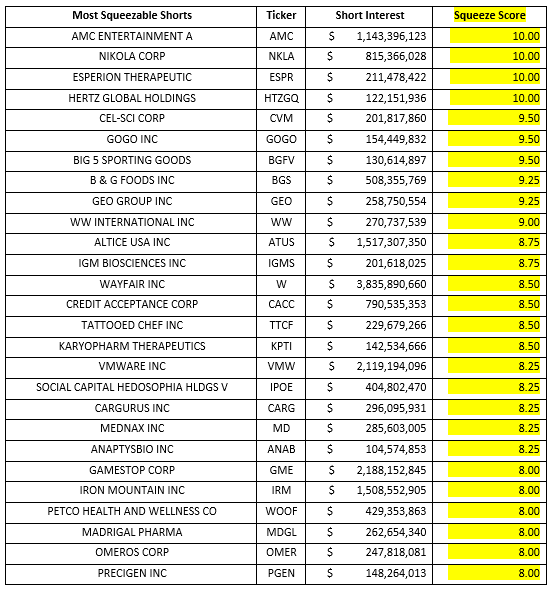
One fallacy that exists on the street is that all crowded shorts are short squeeze candidates. But the reality is that if a trade is crowded but profitable, there is very little chance of a short squeeze. A trader does not usually exit a trade even if they are standing shoulder to shoulder with a stadium full of other traders in that same security if they continue to make money in the trade. The prime catalyst for short squeezes are mark-to-market losses. Combining our Crowded Scores with profitability, or more correctly, lack of profitability is the basis for our Squeeze Scores. Due to the multiple factors in calculating our Squeeze scores, they are highly volatile and change significantly on a weekly basis. The equity\ADR shorts with the highest Squeeze Scores are:
Looking at short selling trends over time provides insight into overall market sentiment as well as the strength of bearish conviction in individual equities. Our Blacklight SaaS platform and Black APP provides an up to date view of short selling and short covering on an equity, sector, index, or country-wide basis allowing investors\traders to better manage their existing long and short positions.
Research Note written by Ihor Dusaniwsky, Managing Director of Predictive Analytics, S3 Partners, LLC
For deeper insight into short side data and analysis contact me at Ihor.Dusaniwsky@S3Partners.com
Click for 10 Day Complimentary Access to Bloomberg/S3 Black App Pro
The information herein (some of which has been obtained from third party sources without verification) is believed by S3 Partners, LLC (“S3 Partners”) to be reliable and accurate. Neither S3 Partners nor any of its affiliates makes any representation as to the accuracy or completeness of the information herein or accepts liability arising from its use. Prior to making any decisions based on the information herein, you should determine, without reliance upon S3 Partners, the economic risks, and merits, as well as the legal, tax, accounting, and investment consequences, of such decisions.