CNBC recently created a new index which tracks “stocks integral to lives and careers of millennials and those from Generation Z”. According to CNBC the index is up over 40% in 2021, but down over the last month. Going long meme and Reddit names has been the new trend in 2021, will buying and shorting the CNBC Next Gen Index be the new retail vs institutional battle ground?
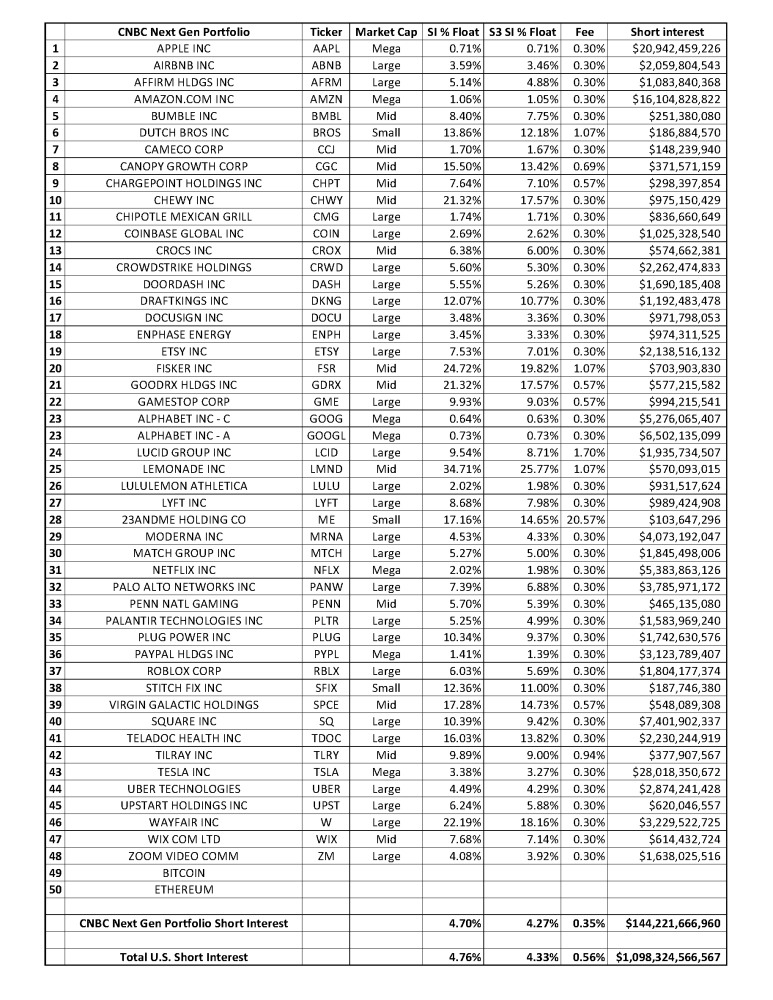
The CNBC Next Gen Index is made up of equal weighted investments in forty-eight stocks and two crypto currencies. Total short interest in the stocks that make up the index is $144 billion, or $1 out of every $8 shorted in the total equity\ADR short interest in the U.S. market. While Short Interest % Float for both the index and U.S. market are relatively equal, 4.70% vs 4.76%, the cost to borrow the Index names is much cheaper, 0.35% fee vs 0.56% fee.
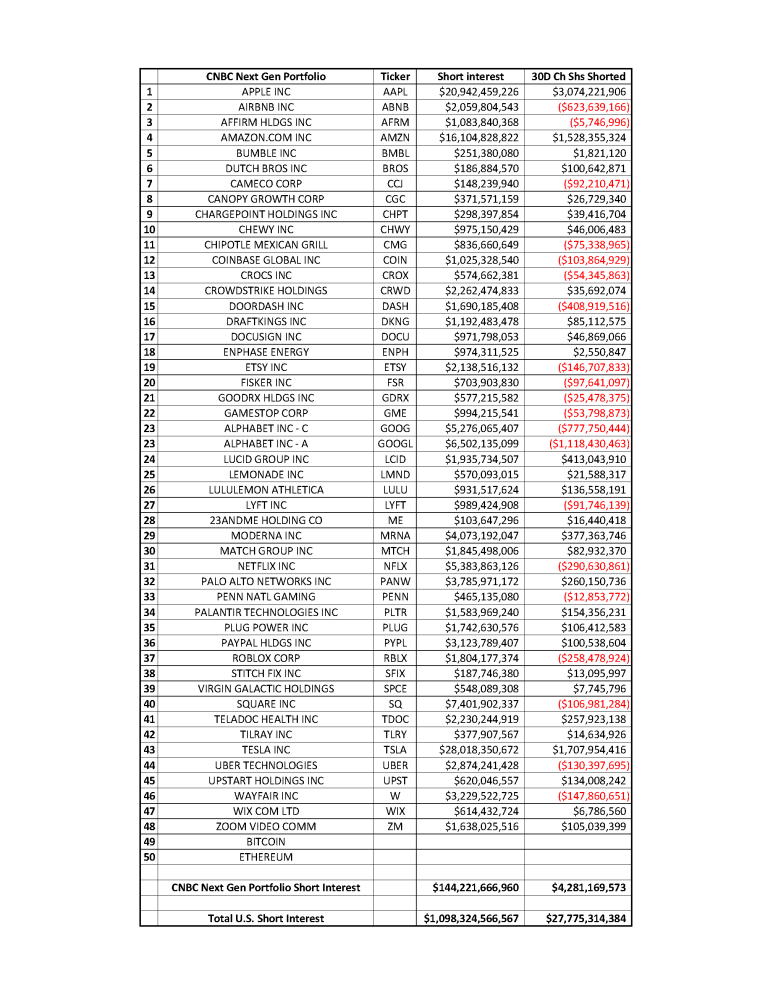
 Over the last thirty days we have seen increased short selling in the U.S. market and the CNBC Next Gen Index saw slightly above average short selling than the overall U.S. market. Total short selling over the last thirty days in the Index was $4.3 billion with the largest amount of new short selling occurring in Apple Inc (AAPL), Amazon.com Inc (AMZN) and Tesla Inc (TSLA) while we saw large short covering in Alphabet Inc (GOOG\GOOGL).
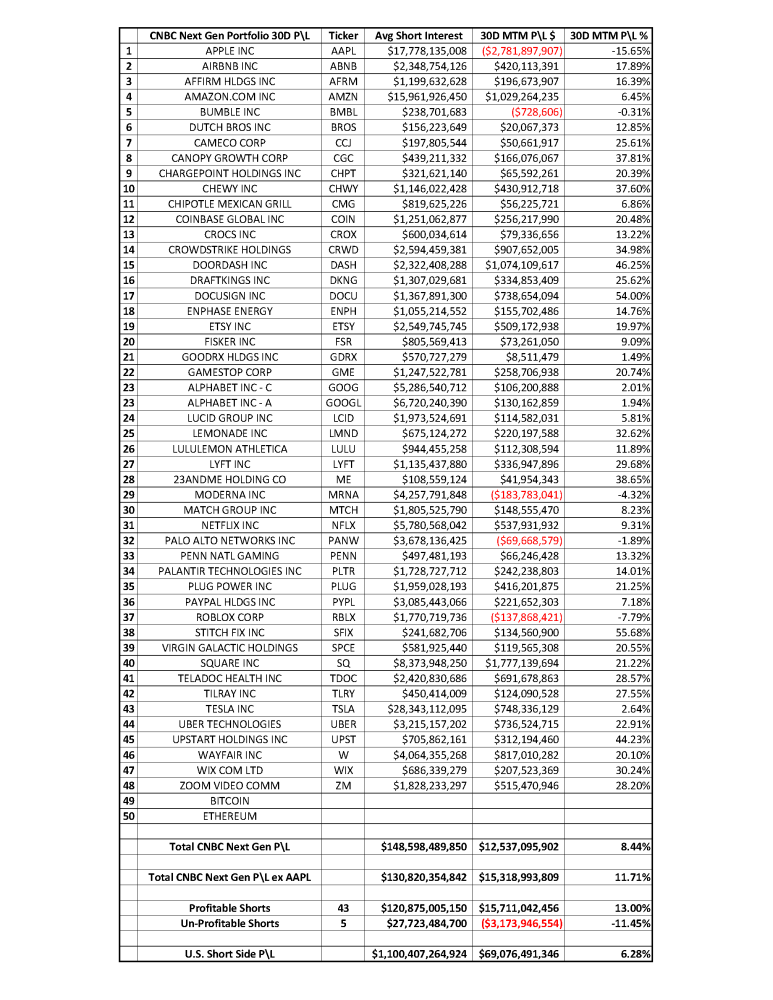
 Shorting the stocks in the CNBC Next Gen Index was profitable over the last thirty days with winners outpacing losers 9-1. Overall, the short sellers were up +$12.5 billion in mark-to-market profits, +8.44% over the last thirty days. But they were up +$15.3 billion, +11.71%, if we exclude the outsized -$2.8 billion in AAPL losses. The returns in shorting the Index compare favorably to shorting in the U.S. market over the last thirty days, which were up +$69.1 billion, +6.28%.

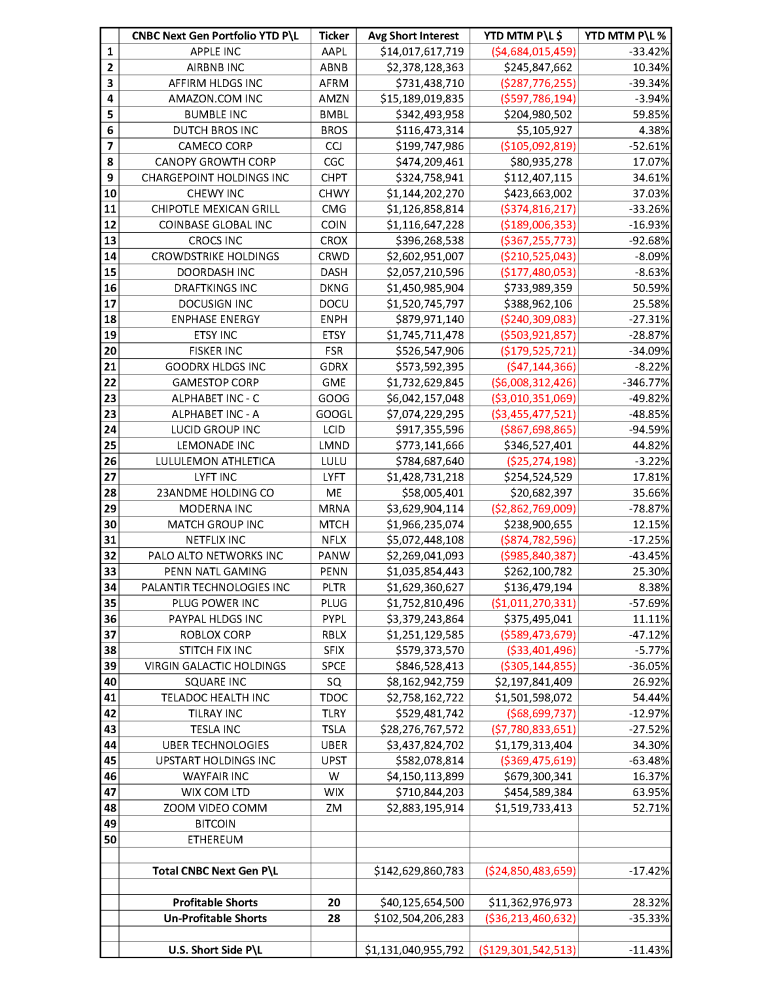
But over the last year, short sellers in CNBC Next Gen Index stocks are down -$24.9 billion in year-to-date mark-to-market losses, down -17.42%. This compares unfavorably to short sellers in the U.S. market who are down -$129 billion, -11.43%, in year-to-date mark-to-market losses. Winners and losers in the sector are fairly balanced with twenty-eight winners vs twenty losers, but the losing bets were larger with only $40 billion in profitable positions versus $103 billion in un-profitable positions.
For the year, the most profitable shorts in the Index on a percentage basis were WIX.com (WIX), Bumble Inc (BMBL), Teledoc Health Inc (TDOC), Zoom Video Comm (ZM) and DraftKings Inc (DKNG). While the most unprofitable trades were in Gamestop Corp (GME), Lucid Group Inc (LCIS), Crocs Inc (CROX), Moderna Inc (MRNS) and Upstart Holdings Inc (UPST).

The volatility in the stocks in the CNBC Next Gen Index will entice both long shareholders and short sellers. While many of the stocks are too large for retail investors to affect a long-term short squeeze in these stocks, the volatile price swings will be enticing short sellers into the names on downswings and conversely forcing them out on upswings. Therefore, most of the stocks in the Index will have both buy-side and sell-side pressure creating more drastic changes in price when the momentum pendulum swings from one side to the other. Paraphrasing Bette Davis in “All About Eve” – fasten your seat belts, it’s going to be a bumpy market.
Looking at short selling trends over time provides insight into overall market sentiment as well as the strength of bearish conviction in individual equities. Our Blacklight SaaS platform and Black APP provides an up-to-date view of short selling and short covering on an equity, sector, index, or country-wide basis allowing investors\traders to better manage their existing long and short positions.
Research Note written by Ihor Dusaniwsky, Managing Director of Predictive Analytics, S3 Partners, LLC
For deeper insight into short side data and analysis contact me at Ihor.Dusaniwsky@S3Partners.com
For short side data and access to our research reports go to https://research.s3partners.com .
Click for 10 Day Complimentary Access to Bloomberg/S3 Black App Pro
The information herein (some of which has been obtained from third party sources without verification) is believed by S3 Partners, LLC (“S3 Partners”) to be reliable and accurate. Neither S3 Partners nor any of its affiliates makes any representation as to the accuracy or completeness of the information herein or accepts liability arising from its use. Prior to making any decisions based on the information herein, you should determine, without reliance upon S3 Partners, the economic risks, and merits, as well as the legal, tax, accounting, and investment consequences, of such decisions.