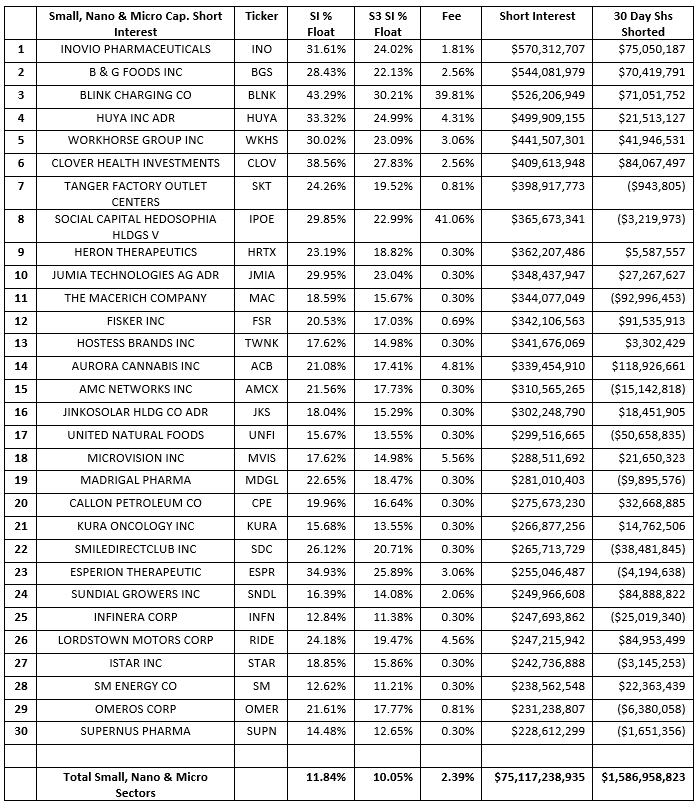
Total short interest in the U.S. equity\ADR market is $1.07 billion with the vast majority of that short exposure occurring in the largest cap securities. Short sellers may have concentrated their activity in the most liquid and cheapest to short stocks in the mega, large and mid-cap sectors, they have still been very active in lesser capitalized securities. While 93% of every dollar shorted is directed at the largest cap securities, 68% of the actual equities\ADRs shorted lie in the smaller cap sectors. Short sellers are finding potential Alpha in smaller cap stocks where they are not shoulder to shoulder with the rest of the street and hope to produce profits which can differentiate their portfolio from the herd. While we saw $42.4 billion worth of short covering in the larger market cap shorts, we saw $1.6 billion of new short selling in the smaller cap shorts, it seems that short sellers were looking for Alpha in all the wrong places and are now re-jiggering their portfolios a bit.

Due to the smaller amount of float in the smaller cap stocks there are drawbacks when shorting these securities. Short Interest % of Float in the smaller cap stocks is over twice as large as the larger cap sectors. The relative lack of stock loan availability invariably leads to higher stock borrow rates with the average stock borrow fee of larger caps stocks is just over General Collateral levels (the cheapest fees for the easiest to borrow stocks) at 0.38% fee while the average stock borrow fee for the smaller cap stocks is over six times more expensive at 2.39% fee. There is also an increased risk of stock borrow recalls as the lack of overall supply reduces the chances of finding replacement stock if a beneficial owner sells the shares they are lending. But the possibility of higher expected Alpha and more unique profitability streams may make these excess risks and costs palatable.

While short interest in these names may not be as large as Tesla Inc (TSLA) or Amazon Inc (AMZN) these may the up and comers as newer\smaller shorts in the market.
Some of the more crowded smaller cap shorts, as identified by our Crowded\Squeeze Score, are Esperion Therapeutic (ESPR), B & G Foods Inc (BGS), Social Capital Hedosophia Hldgs V (IPOE), Blink Charging Co (BLNK), Cel-Sci Corp (CVM), Huya Inc ADR (HUYA), Inovia Pharmaceuticals (INO) and Tanger Factory Outlet Centers (SKT). These are stocks which not only have larger short interest but may also have less liquidity in the stock borrow market, less daily trading liquidity relative to the size of shares shorted and higher short selling relative to their float. This is not to say that they are unattractive short plays, their expected Alpha may far away the Crowdedness of the trade.
A Crowded stock does not necessarily mean that it is has high short squeeze potential. An investor will not exit a trade that is profitable simply due to the fact that it is crowded. The primary impetus for a squeeze are mark-to-market losses. Smaller cap stocks with high Squeeze Scores are Esperion Therapeutic (ESPR), Cel-Sci Corp (CVM), Precigen Inc (PGEN), Cortexyme Inc (CRTX), Heron Therapeutics (HRTX), B & G Foods Inc (BGS), Omeros Corp (OMER) and PetIQ Inc (PETQ).
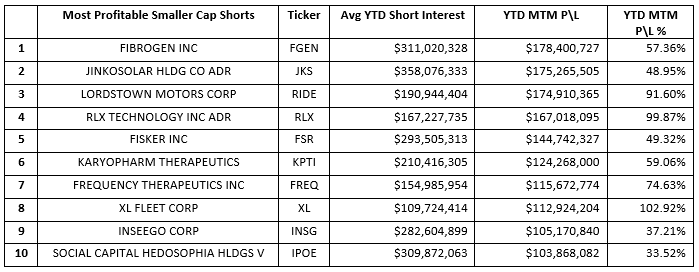
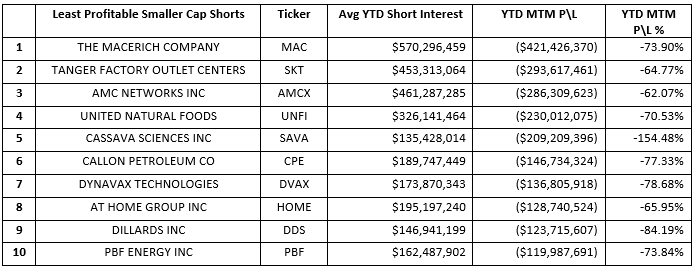
The $1.08 billion of larger cap shorts are down -$114.4 billion in year-to-date net-of-financing mark-to-market losses, down -10.64% for the year. But the $79.1 billion of smaller cap shorts were down -$3.2 billion in year-to-date net-of-financing mark-to-market losses, down only -3.99% for the year. More interestingly, the 1,322 profitable larger cap shorts had an average return of +14.68% while the 4,912 profitable smaller cap shorts had an average return of +26.71%. Short selling in the smaller pond of smaller cap stocks produced larger catches possibly because there were fewer hooks in the water.
The most and least profitable smaller cap shorts are:


Looking at short selling trends over time provides insight into overall market sentiment as well as the strength of bearish conviction in individual equities. Our Blacklight SaaS platform and Black APP provides an up to date view of short selling and short covering on an equity, sector, index, or country-wide basis allowing investors\traders to better manage their existing long and short positions.
Research Note written by Ihor Dusaniwsky, Managing Director of Predictive Analytics, S3 Partners, LLC
For deeper insight into short side data and analysis contact me at Ihor.Dusaniwsky@S3Partners.com
Click for 10 Day Complimentary Access to Bloomberg/S3 Black App Pro
The information herein (some of which has been obtained from third party sources without verification) is believed by S3 Partners, LLC (“S3 Partners”) to be reliable and accurate. Neither S3 Partners nor any of its affiliates makes any representation as to the accuracy or completeness of the information herein or accepts liability arising from its use. Prior to making any decisions based on the information herein, you should determine, without reliance upon S3 Partners, the economic risks, and merits, as well as the legal, tax, accounting, and investment consequences, of such decisions.