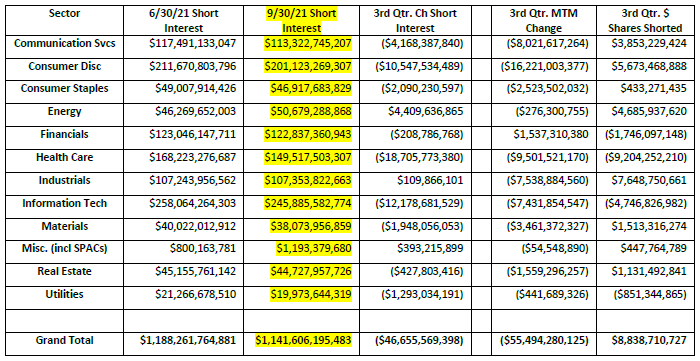
Short interest in the domestic market decreased by -$46.7 billion, or -3.93%, to $1.14 trillion in the third quarter of 2021. Even though the overall market was relatively flat (S&P 500 up +0.23%, Nasdaq down -0.38% and Russell 3000 down -0.43%), the majority of this decrease, -$55.5 billion, came from mark-to-market depreciation of the shorted securities. There was also +$8.8 billion of additional short selling in the quarter as short sellers increased their bets on potential market underperformers.
The sectors with the largest decrease in short exposure were Health Care (-$19 billion), Information Technology (-$12 billion) and Consumer Discretionary (-$11 billion). Surprisingly, these were three of the four sectors with the largest increase in short interest in the 2nd quarter of this year. Only one sector had a significant increase in short exposure in the 3rd quarter, the Energy sector was up +$4.4 billion.
Short exposure continues to be concentrated in several sectors: Information Technology ($258 billion), Consumer Discretionary ($211 billion) and Health Care ($168 billion).

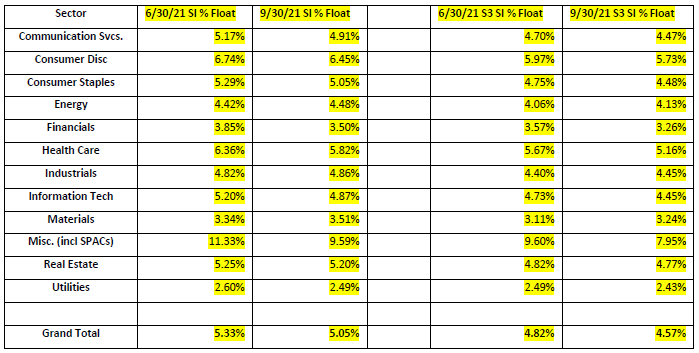
Market wide Short Interest as a % of Float declined moderately in the 3rd quarter, decreasing -28 bps from 5.33% to 5.05%. But there were several sectors with some movement. The Health Care sector had a -0.54% decrease in SI % Float to 5.82% as we saw appreciable short covering in the sector. The Miscellaneous (primarily SPACs) sector has the largest SI % Float at 9.59% and Consumer Discretionary (6.45%) was the only other sector over 6%.
The S3 SI % Float, which includes the synthetic long shares created by every short sale in the denominator, fell -25 bps over the quarter, from 4.82% to 4.57%.

It became slightly cheaper, on average, to short stocks in the 3rd quarter as the average stock loan fee fell -3 bps from 0.72% fee to 0.69% fee. Due to the limited stock borrow availability, SPAC stock loan rates in the Miscellaneous sector continued to be the most expensive sector to short with rates rising +49 bps from 5.21% to 5.70%.

Overall short sellers paid $1.86 billion in stock borrow fees in the 3rd quarter of 2021 (calculated daily borrow cost using S3’s offer rate) versus $2.07 billion in stock borrow expenses in the 2nd quarter of 2021. The ten stocks that short sellers had the most conviction and paid the most to short made up 17% of the total borrow cost in the quarter, they were: HOOD (-$79mm), CPNG (-$60mm), LCID (-53mm), IRNT (-$24mm), VMW (-$23mm), FFIE (-$22mm), TSLA (-16mm), CVAC (-$16mm), GREE (-$14mm) and BLNK (-$14mm). BLNK is the only stock to be in the top ten for two quarters in a row, financing costs have reduced their mark-to-market profits. but BLNK short sellers were still up +35% in the 3rd quarter even after paying away -13% is stock borrow financing costs.
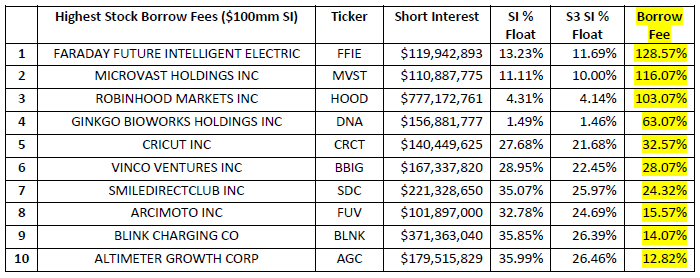
High stock borrow fees can test the conviction level of short sellers as financing costs can take a large bite out of expected Alpha. The highest stock borrow fees, as of September 30th, for stocks with over $100 million of short interest were:

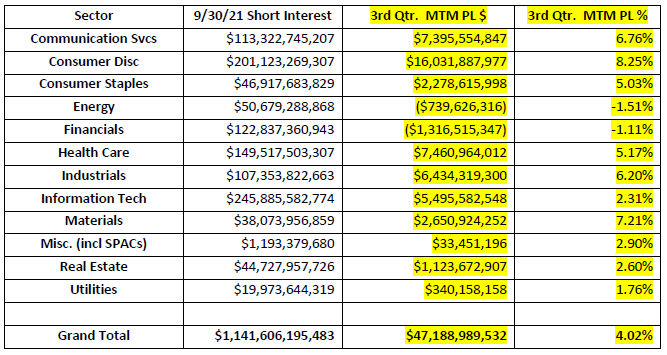
Short sellers were up +$47.2 billion in 3rd quarter mark-to-market profits, +4.02%. With the Russell 3000 down only -0.43% for the quarter, short sellers outperformed the market significantly by being good stock pickers.
There were 9,551 shorted equities with positive P\L, producing +$96.6 billion in profits, +14.4%. The five largest short-side winners in the 3rd quarter were: BABA (+$3.93bn), AMC (+(1.42bn), ZM (+$1.32bn), NIO (+$1.06bn), W (+$964mm).
There were 6,195 shorted equities with negative P\L, producing -$49.4 billion in losses, -9.8%. The five largest short-side losers in the 3rd quarter were: TSLA (-$2.63bn), MRNA (-$2.51bn), AMD (-$984mm), SE (-$844mm) and AON (-$838mm)
There were more profitable shorts than unprofitable shorts in the 3rd quarter with 61% of all short positions adding positive numbers to a trader’s bottom lines.
The most profitable shorted sectors were Consumer Discretionary (+8.25%) and Materials (+7.21%) while the least profitable shorted sectors were Energy (-1.51%) and Financials (-1.11%).

Our Blacklight SaaS platform and Black App provides an up-to-date view of short selling and short covering on an equity, sector, index, or country-wide basis allowing investors\traders to better manage their existing long and short positions.
Research Note written by Ihor Dusaniwsky, Managing Director of Predictive Analytics, S3 Partners, LLC
For deeper insight into short side data and analysis contact me at Ihor.Dusaniwsky@S3Partners.com
For short side data and access to our research reports go to https://research.s3partners.com/ .