We follow 1,468 SPAC securities (equities and warrants) that have short interest on our Blacklight SaaS Platform and Black App. Total short interest in the SPAC sector had been declining over the past few months as large SPAC short positions such as Churchill Capital Corp IV (CCIV), Social Capital Hedosophia Holdings V (IPOE) and Switchback Energy Acquisition Corp (SBE) were de-SPACed, but we have seen a recent rise in SPAC short interest. Total SPAC short interest is now $1.21 billion, an increase of +$443 million over the last thirty days. Most of this increase can be attributed to new short selling activity in the Digital World Acquisition Corp (DWAC) SPAC. 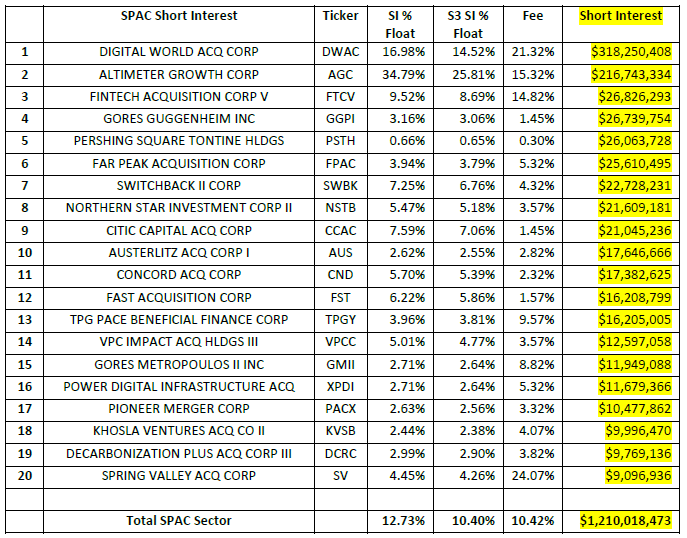 The SPAC sector’s average Short Interest % Float is 12.76% while the average S3 SI % Float of 10.40% (which includes the synthetic longs created by every short sale in the trade float denominator) with an average stock borrow fee of 10.42%. In contrast, stocks in the U.S. have a total short interest of $1.18 trillion, SI % Float of 5.17%, S3 SI % Float of 4.68% and an average stock borrow fee of 0.71%.
Total short interest in the SPAC sector has increased from $767 million to $1.21 billion over the last 30 days. This +$443 million increase consisted of a +$59 million change in market value due to stock price increases and an additional +$384 million of new short selling.
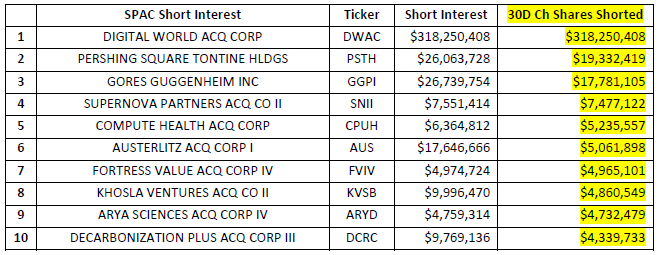
There were only three SPACs with over $10 million of new short selling over the last thirty days. Digital World Acquisition Corp (DWAC), which is taking former President Trump’s social-media venture public, made up the majority of SPAC short selling. We saw DWAC’s short interest increase by $318 million as its stock price rose +581% in October.
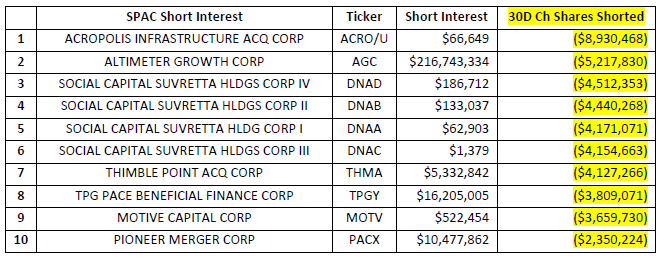
 And SPAC short covering was muted over the last thirty days with no SPAC with more than $10 million of buy-to-covers:
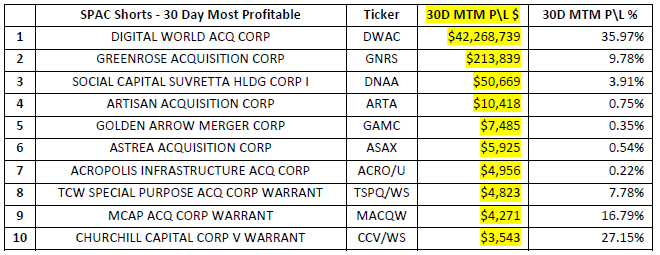
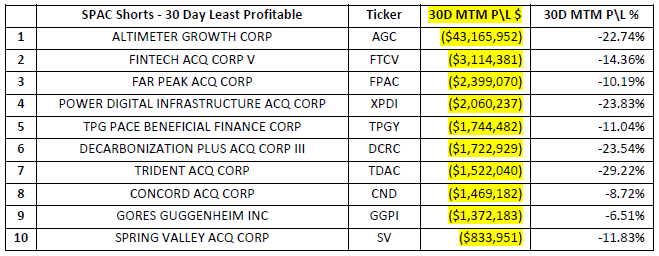
 SPAC short sellers were down -$24 million, -2.61%, in net-of-financing mark-to-market losses over the last 30 days. There was some price volatility in the SPAC sector over the last thirty days with 28% of the shorted SPAC securities profitable, up $43 million in mark-to-market profits, +29.5%. The 72% of unprofitable shorted SPAC stocks were down -$67 million, -8.46%.
 Shorting SPACs has a peculiar issue than shorting most other larger cap securities, due to the relatively high percentage of retail long shareholders there is a lack of stock loan supply from the start. Retail shareholders are not usually in stock lending programs and tend have fully paid holdings and do not use margin, which limits the capabilities of brokers using their positions as collateral and lending out their shares. In addition to the elevated level of retail (non-lending) long shareholders is the fact that SPAC securities are not in indexes and therefore not held in size by longer term institutional long shareholders (such as pension funds, mutual funds, ETF providers, etc.) who provide most of the lendable liquidity in the stock loan market. With these two strikes against them, short sellers may have a challenging time locating the more popular SPAC stock borrows to settle short sales and if they do, rates on those stock borrows are usually more expensive than traditional equities.
A good example of stock loan limiting short selling activity is Digital World Acquisition Crop (DWAC). Short selling demand was quite high when DWAC’s stock price spiked but shorts were not able to short in size. Stock borrow costs hit the 200% fee level on some stock loans as demand overwhelmed supply in late October. Rates have since eased as more stock became available, with stock borrows now at the 10% to 15% fee range. Even with these high stock borrow rates, the DWAC short was a profitable trade if you were able to get a short locate. Short sellers are up over +$42 million in mark-to-market profits even after paying -$2 million in stock borrow costs.
Looking at short selling trends over time provides insight into overall market sentiment as well as the strength of bearish conviction in individual equities. Our Blacklight SaaS platform and Black APP provides an up-to-date view of short selling and short covering on an equity, sector, index, or country-wide basis allowing investors\traders to better manage their existing long and short positions.
Research Note written by Ihor Dusaniwsky, Managing Director of Predictive Analytics, S3 Partners, LLC
For deeper insight into short side data and analysis contact me at Ihor.Dusaniwsky@S3Partners.com
For short side data and access to our research reports go to https://research.s3partners.com .
Click for 10 Day Complimentary Access to Bloomberg/S3 Black App Pro
The information herein (some of which has been obtained from third party sources without verification) is believed by S3 Partners, LLC (“S3 Partners”) to be reliable and accurate. Neither S3 Partners nor any of its affiliates makes any representation as to the accuracy or completeness of the information herein or accepts liability arising from its use. Prior to making any decisions based on the information herein, you should determine, without reliance upon S3 Partners, the economic risks, and merits, as well as the legal, tax, accounting, and investment consequences, of such decisions.