We follow 172 shorted U.S. domestic biotech stocks with total short interest of $47.2 billion. Short selling in these stocks is highly concentrated, with the top twenty most shorted stocks totaling $37.1 billion, making up 79% of the total shorts in the market.
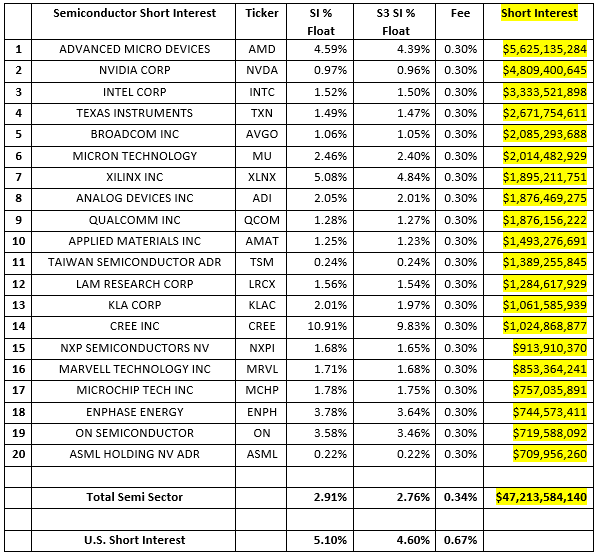
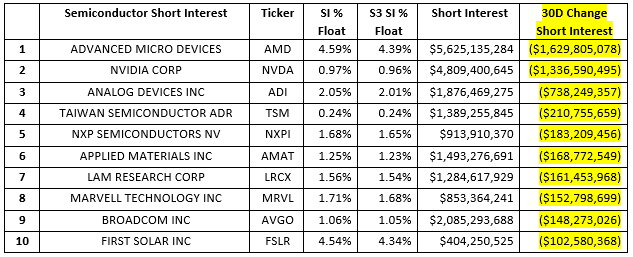
The semiconductor market had been rallying for most of the year but since mid-September we’ve seen a pullback in semiconductor stocks. The iShares Semiconductor ETF (SOXX) is up 19.52% for the year it is down -3.78% over the last thirty days and down -3.22% over the last seven days and the VanEck Semiconductor ETF (SMH) is up +19.26% for the year, down -4.25% over the last thirty days and down -3.43% over the last seven days. The recent price weakness in the sector has decreased the market value of semiconductor shares shorted but short sellers are not selling into this price weakness. The decrease in price and decrease in shares shorted has lowered total short interest in the sector down -$4.52 billion.
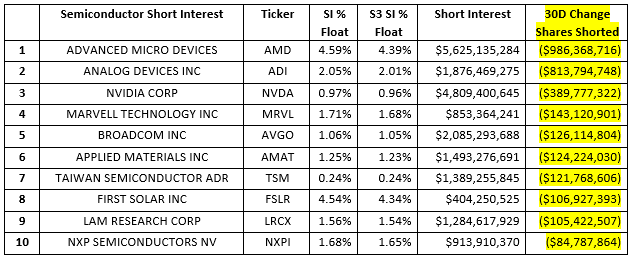
The following stocks had the largest reduction of short exposure over the last thirty days.
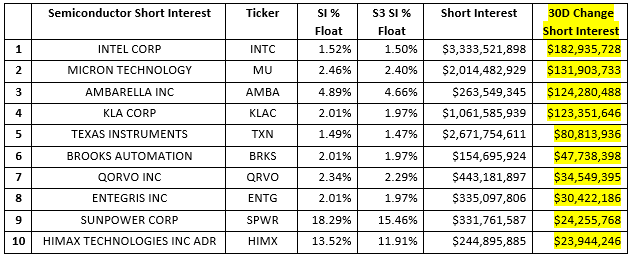 The following stocks had the largest reduction of short exposure over the last thirty days.
 Changes in a stock’s short interest are made up of mark-to-market price moves and either short selling or short covering activity. While both change the overall amount of short interest in a stock, short selling and covering have a direct impact on the daily price moves of a stock. Shorts have bought to cover $2.13 billion worth of their semiconductor short positions over the last thirty days, taking some of their recent profits (which covered a large portion of their early year losses) and exiting the sector.
The following stocks had the largest increase in short selling activity over the last thirty days.
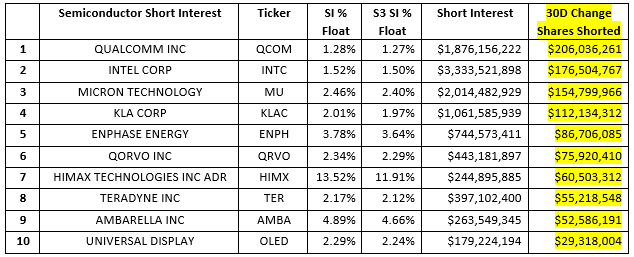
And the following stocks had the largest amount of short covering over the last thirty days.
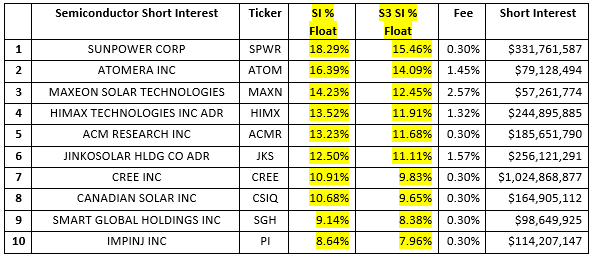
 High Short Interest as a % of Float is a factor in the “crowdedness” of a shorted stock. Higher numbers can have negative effects on stock loan liquidity as well as trading liquidity. The following are semiconductor stocks with highest SI % Float and short interest over $50 million. The average SI % of Float in the U.S. is 5.10% while the average S3 SI % Float, which includes the synthetic longs created by every short sale in the Float denominator, is 4.60%. Because the majority of the most shorted semiconductor stocks are large or mega-cap names, the average SI % Float of 2.91% is substantially below the U.S. market average.
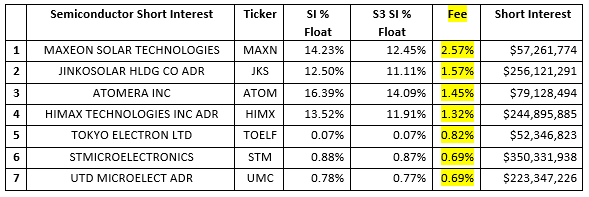
 With sizable stock borrow availability in most semiconductor names due to their large market caps and inclusion in long asset managers portfolios who generally lend to the street, most semiconductor stock borrow costs are at the General Collateral level (0.30% fee for the easiest to borrow securities). There are only seven U.S. semiconductor stocks with short interest over $50 million that are above G.C. levels:
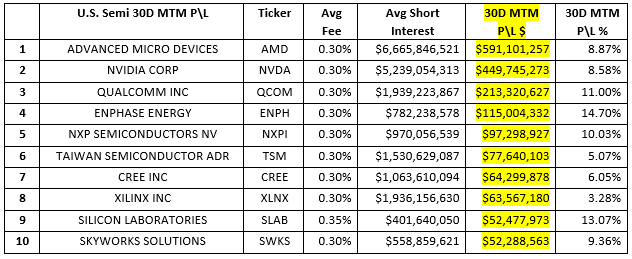
 Overall, U.S. semiconductor short sellers are up +$1.90 billion in net of financing mark-to-market profits over the last thirty days. A return of +3.81% on an average short interest of $49.9 billion.
Short sellers are still in the red for the year, with year-to-date net-of-financing mark-to market losses in the U.S. market now at -$9.00 billion, a -16.34% return on an average short interest of $55.08 billion. Semiconductor shorts have made back 17% of their year-to-date losses over the last thirty days.
The following are the most profitable shorts over the last thirty days:
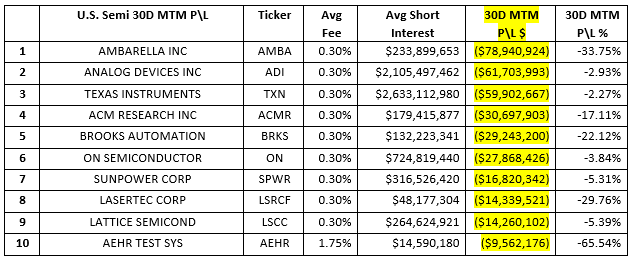
 And the least profitable shorts over the last thirty days:
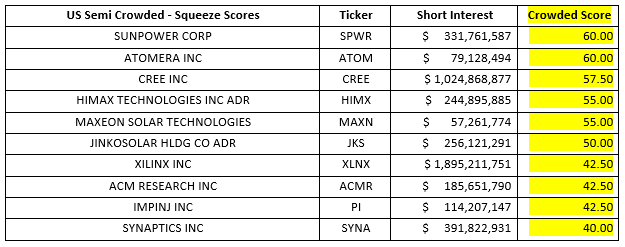
The definition of a “crowded” short trade varies from investor to investor but there are several themes that remain constant. A short can be considered to be “crowded” if some or all of the following occur: there are large amount of dollars at risk on the short side, a large proportion of a stock’s float is being shorted, there is illiquidity in the stock loan market and\or there is illiquidity in the trading market. With stock borrow costs generally low, large floats and active daily trading volumes semiconductor stocks are rarely crowded on the short side with few names crossing over the 70/100 threshold. The ten most crowded U.S. semiconductor stocks with over $50 million of short interest, according to our Crowded Score, are:
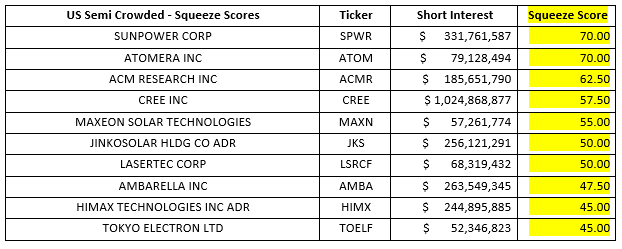
 Not every Crowded stock is a Squeeze candidate. By overlaying our Squeeze algorithm over our Crowded Score, we can determine which U.S. traded stocks have the highest potential for a Squeeze, and which do not. The following ten semiconductor stocks have earned our highest Squeeze Scores, which does not mean a Squeeze will definitely occur, but means that if the present trends continue, there is a good chance for a Squeeze. Just like in our Crowded Score calculation, there are not really any stocks that are truly squeezable although SunPower Corp (SPWR) and Atomera Inc (ATOM) may slide over the 70\100 level if shorts incur more mark-to-market losses.
 Looking at short selling trends over time provides insight into overall market sentiment as well as the strength of bearish conviction in individual equities. Our Blacklight SaaS platform and Black APP provides an up to date view of short selling and short covering on an equity, sector, index, or country-wide basis allowing investors\traders to better manage their existing long and short positions.
Research Note written by Ihor Dusaniwsky, Managing Director of Predictive Analytics, S3 Partners, LLC
For deeper insight into short side data and analysis contact me at Ihor.Dusaniwsky@S3Partners.com
For short side data and access to our research reports go to https://research.s3partners.com