There are 2,235 ETFs with active shares shorted in our Blacklight SaaS platform and Black App with $260 billion of short interest. Average Short Interest % of Float is 21.70% and S3 SI % Float (which includes synthetic longs created by every short sale in the Float number) is 15.95% while the average stock borrow fee is 0.76%. As a comparison, U.S. equites have an average SI % Float of 5.30%, S3 SI % Float of 4.77% and average stock borrow fee of 0.53%.
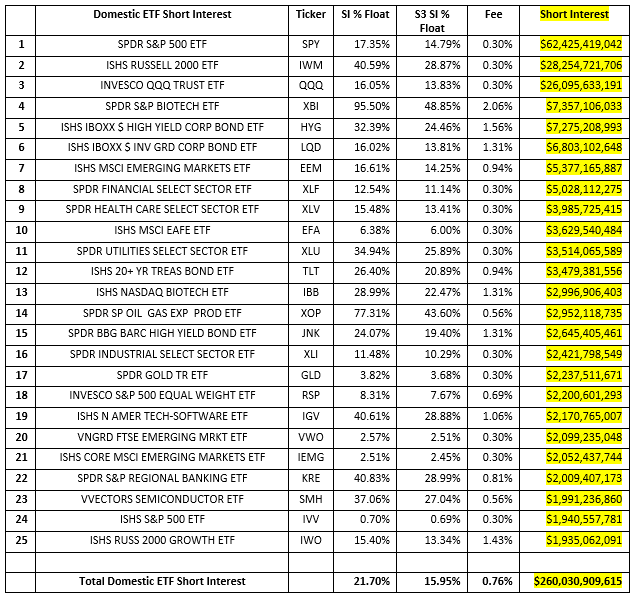
Overall ETF short exposure increased from $248.2 billion to $260.0 billion, an increase of +$11.8 billion or +5%, over the last 30 days. Change in short interest is comprised of mark-to-market price changes of existing shorts and short selling and covering. Over the last 30 days we saw a +$12.6 billion increase in the market-to-market value of existing short positions offset by -$784 million of net short covering. ETF short sellers experienced an increase in exposure due to a broad market rally but did not cover their short positions to offset that increase. This indicates that they were not averse to the increased short ETF exposure, either as portfolio hedges or outright risk positions. Interestingly, there was an obvious change in portfolio hedging instruments with short covering in the narrower larger cap SPY ETF but increased short selling in the broader IWM ETF and tech heavy QQQ ETF. Investors also covered over $2 billion of the corporate bond ETFs, HYG and LQD.
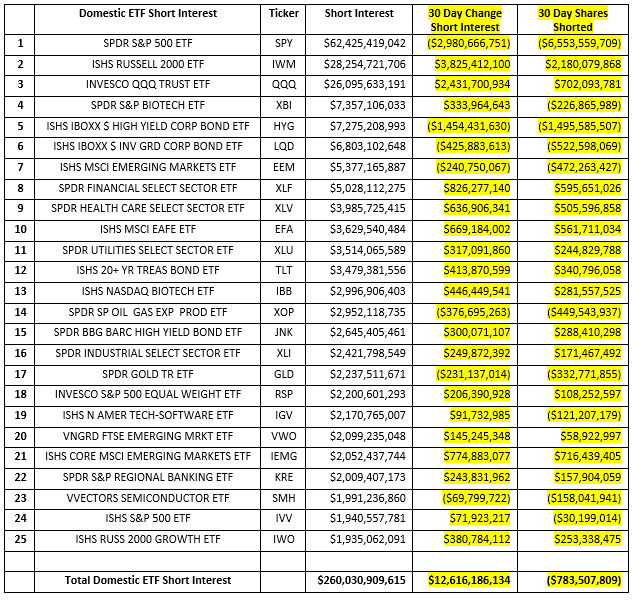
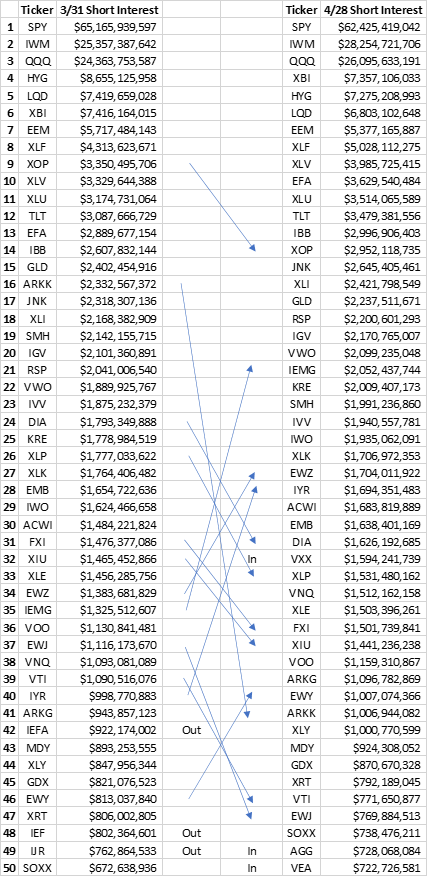
The previous chart shows movement in the top 50 ETF shorts since 3\31. Highlighted are ETFs which either gained or lost 5 spots in the short interest league table. The top 15 spots rarely change much, with ETFs moving 1-3 spots on a monthly basis. But the latter half of the group is usually involved in a game of musical chairs as market conditions change. One interesting addition to the top 50 was the VXX ETF jumping from #64 to #32 as investors are looking for exposure to market volatility.
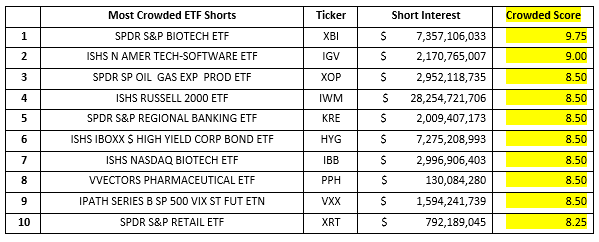
ETF short interest as a % of Float is a much more fluid metric than it is for equities and ADRs as ETFs are constantly created and\or redeemed which changes their shares outstanding\float numbers sometimes on a daily basis. The VXX, XBI and XRT ETFs have the highest SI % Float as these shares are being rehypothicated and margined to be used for stock loan inventory instead of created to increase the available lending pool.
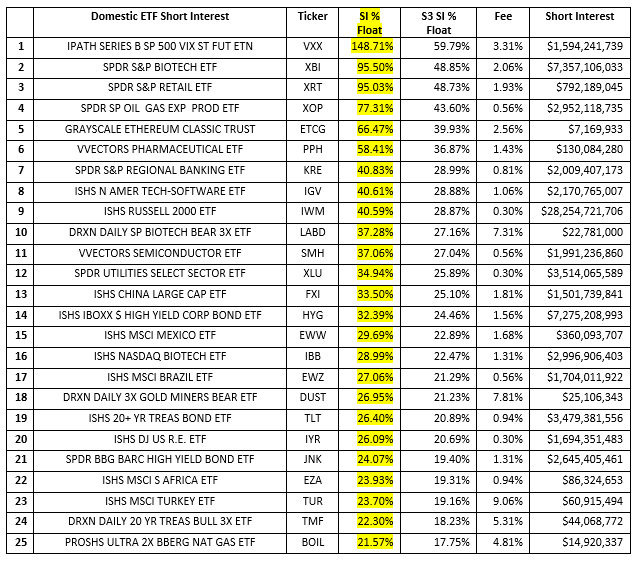
SI % Float is just one of the variables in our multi-factor Crowded Score along with the overall size of the short, stock borrow liquidity\costs and trading liquidity. Looking at all these factors, the most crowded ETF shorts all have high Short Interest % of Float numbers, but the other factors change the rankings in the Crowded league table.
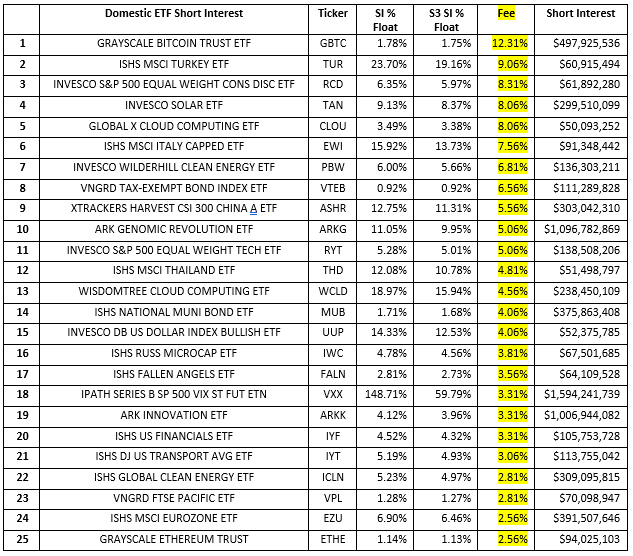
ETF stock borrow fees rarely get very expensive (over 10% fee) as brokers will create ETF shares in order to meet stock borrow demand as rates make the share creation and hedging profitable. Rates in certain ETFs tend to climb for two main reasons, there is very little marginable or rehypothicatable stock in the market which limits the stock lending availability pool or the process of creating and hedging the ETF is difficult or very expensive.
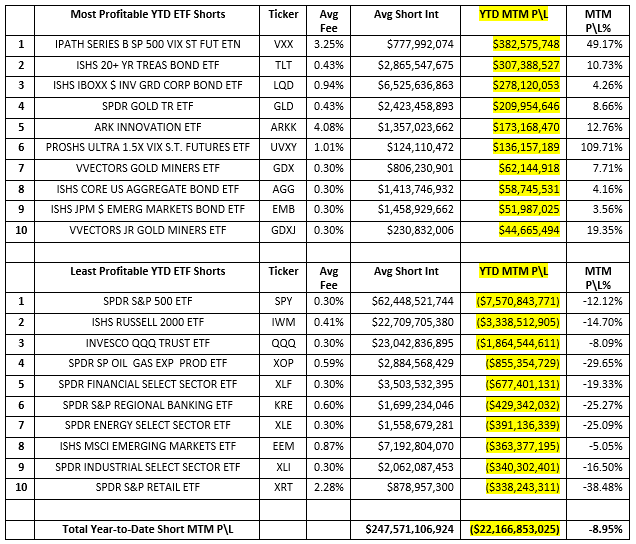
Institutionally ETFs are primarily used as a portfolio hedging vehicles (SPY, IWM & QQQ shorts make up 45% of total ETF short interest) so one can expect that in an upward trending market most of the larger ETF short positions would have negative returns. ETF shorts are down -$27.17 billion, -8.95%, in year-to-date net-of financing mark-to-market losses. The worst performers were, as expected, the SPY, IWM and QQQ ETFs but the best performers were a mix of hedging and Alpha positions in the VIX, fixed income and Gold. One outlier in the most profitable ETF shorts was the ARKK ETF which was a recently heavily shorted position looking for a retracement in the high tech stay at home stocks that performed well over the last year.
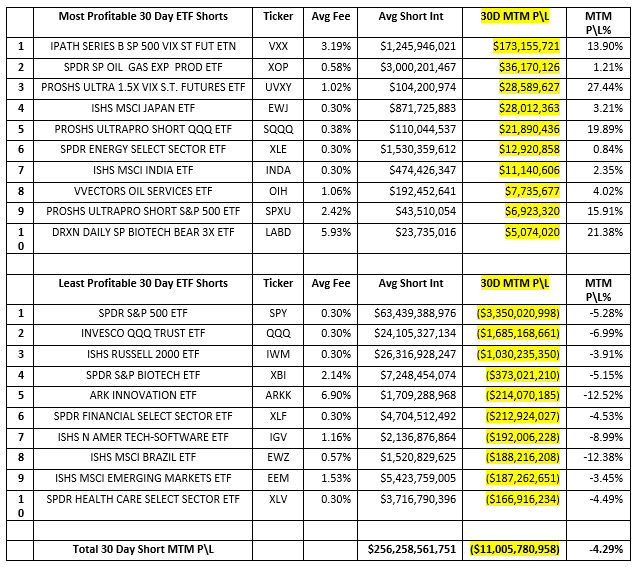
ETF shorts were down -$11.0 billion in mark-to-market losses over the last 30 days with the VIX ETFs being some of the bigger recent winners.
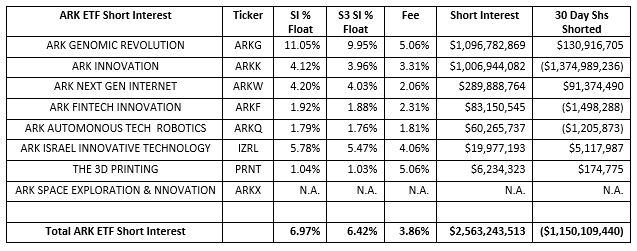
The ARKK ETF has been a very active short recently as there has been a surge of short selling in several of the ARK Investment family of ETFs due to their prior outperformance in the market. The ARKG and ARKK are the largest shorts at the moment but we have seen major short covering in the ARKK ETF over the last 30 days with 58% of its shares shorted covered. Overall, there is $2.56 billion of short exposure in ARK ETF’s even after $1.15 billion of short covering in the group over the last 30 days.
Looking at short selling trends over time provides insight into overall market sentiment as well as the strength of bearish conviction in individual equities. Our Blacklight SaaS platform and Black APP provides an up to date view of short selling and short covering on an equity, sector, index, or country-wide basis allowing investors\traders to better manage their existing long and short positions.
Research Note written by Ihor Dusaniwsky, Managing Director of Predictive Analytics, S3 Partners, LLC
For deeper insight into short side data and analysis contact me at Ihor.Dusaniwsky@S3Partners.com
Click for 10 Day Complimentary Access to Bloomberg/S3 Black App Pro
The information herein (some of which has been obtained from third party sources without verification) is believed by S3 Partners, LLC (“S3 Partners”) to be reliable and accurate. Neither S3 Partners nor any of its affiliates makes any representation as to the accuracy or completeness of the information herein or accepts liability arising from its use. Prior to making any decisions based on the information herein, you should determine, without reliance upon S3 Partners, the economic risks, and merits, as well as the legal, tax, accounting, and investment consequences, of such decisions.